Calibrations Utility
Overview
The Calibrations Utility displays a listing of all calibration data files (*.calDat) stored on the computer. The list can be filtered by beam voltage, element, spectrometer number, sample method, and calibration type. The utility may be used to delete or modify existing calibrations, or to add calculated, user-defined, calibrations. In addition, there are graphing functions available to show relationships between atomic number, elemental composition and date.
Starting the Utility
Clicking the Calibrations button on the SX App Bar opens the Calibrations display window.
Calibrations Window
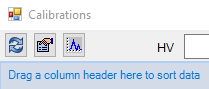
The Refresh button ![]() rescans all *.calDat files and updates the calibration list display.
rescans all *.calDat files and updates the calibration list display.
The Columns button ![]() allows enabling or disabling of displayed parameters.
allows enabling or disabling of displayed parameters.
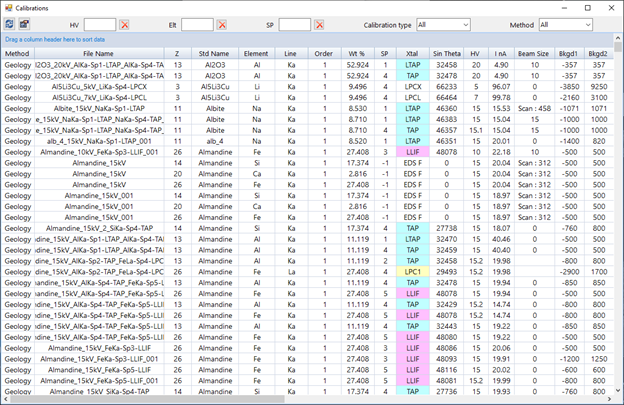
Generally, the most useful columns are: Element, Line, SP, Xtal, HV, Std Name and Acquisition Date. The File Name must also always be displayed. Columns can be reordered by dragging them into the desired position. Column width can be changed by dragging the column separator bar. The appearance of the Data Display Window will be automatically saved and restored at the next launch of the Calibration Utility.
Clicking on the column label sorts the list by values in that column (from low to high). A second click reverses the direction of the sort (from high to low).
Hierarchical groupings (sorting)
By dragging a column header into the region above the list, the calibrations may be grouped by a hierarchical sort of one or more levels. For example, the list could be sorted first by spectrometer number (SP), then by atomic number (Z), then by beam voltage (HV).
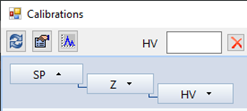
The order of the sort levels can be changed by dragging a column header to a different position. A level can be removed by dragging a column header out of the sort region. If all levels are removed, the list reverts to the default display with no hierarchical sort.
![]()
- HV: Shows only calibrations made at a certain beam voltage. Multiple voltages or a range of voltages may be selected, e.g., “5-10,20,30”.
- Elt.: Shows only calibrations from designated elements. Elements may be entered by atomic number or element symbol. Multiple elements may be entered, separated by commas.
- SP: Shows only calibrations made from a certain spectrometer number. Multiple spectrometer may be entered, separated by commas. Note: EDS is designated as spectrometer ‘-1’.
- Calibration type: Choices are ‘All’, ‘Peak Intensity’ (more common), or ‘Peak Integral’ (less common)
- Method: Calibrations may be placed into one of four different method groups: ‘Geology’, ‘Metallurgy’, ‘Sulphides’ or ‘Other’. If set to ‘All’, calibrations from all groups are displayed.
Drop-down menu functions
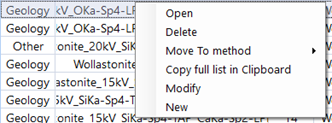
- Open: Launches SXResults (if not already running) and displays the data in the calibration file. (Simply double-clicking on a line in the calibration list has the same effect.)
- Delete: Deletes the selected calibration. Multiple entries can be selected by using shift-click for selection of a continuous set of lines and ctrl-click for selection of a discontinuous set. There may be a delay when deleting many entries at once, as the program refreshes the list.
- Move To method: Changes the Method associated with the calibration file (Geology, Metallurgy, Sulphide, or Other).
- Copy full list in Clipboard: Copies a tab-delimited list of calibration data to the Clipboard, the contents of which may then be pasted into another program for further editing.
- Modify: Allows modification of some parameters of the calibration file.

- New: Creates a completely new calibration file, based on simulated (calculated) or user-defined data.
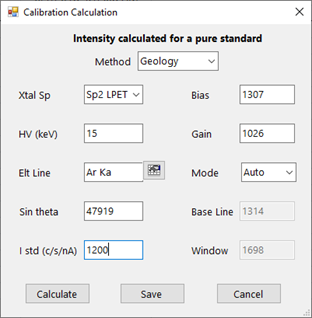
In this example, there is no suitable calibration standard for Ar in the laboratory, so the user has decided to create a calculated Ar calibration. The user picks the Spectrometer, Crystal, Element and Line of interest to use for quantitative analysis. The theoretical line position (Sin theta) is automatically shown, and can be replaced with the true peak position measured on Ar in a sample. If spectrometer efficiency data has been acquired, the Calculate button computes a value for I std, the peak intensity in c/s/nA from a pure element standard. The user can also input their own estimated value for I std. Finally, the user enters detector and PHA measurement parameters to be used during quantitative measurements using this calibration. When the calculated calibration is Saved, it becomes available to use in a Quantitative setup.
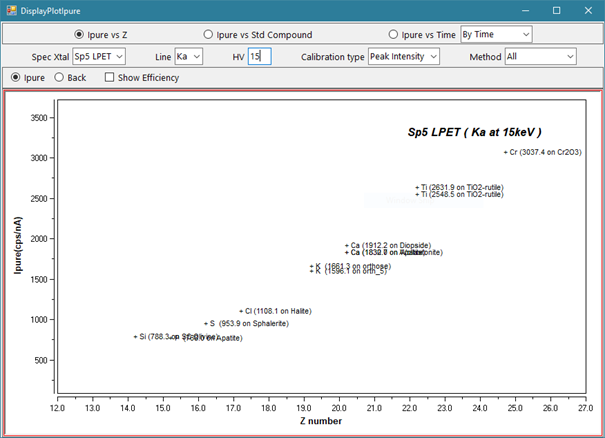
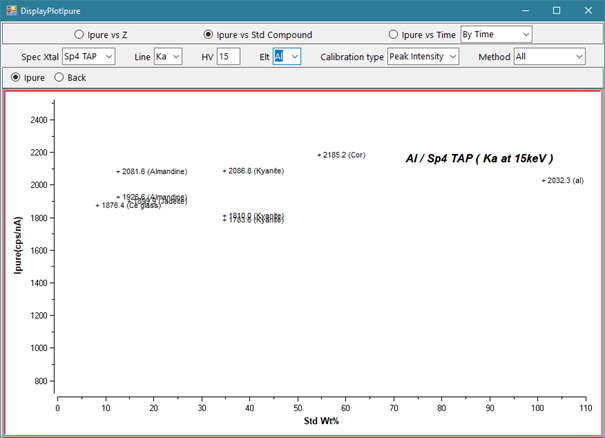
Graphing functions
The graphing button ![]() opens a separate graphing display window*.
opens a separate graphing display window*.
There are three types of graphs:
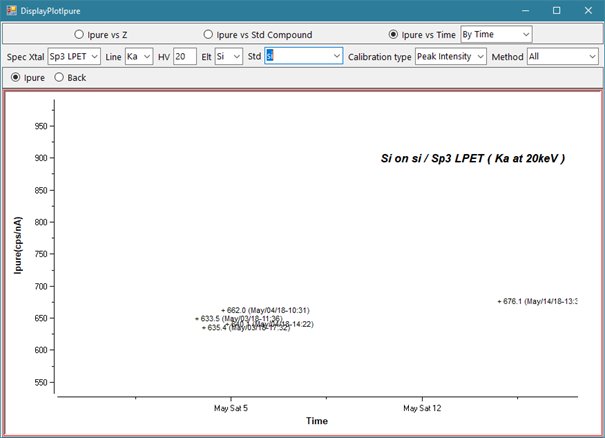
- I Pure vs. Z (calculated intensity of pure element standard vs. atomic number)
- I Pure vs. Std. Compound (calculated intensity of pure element standard vs. weight percent element in compound standards)
- I Pure vs. Time (calculated intensity of pure element standard vs. time of calibration)
All three types of graph are useful for checking the operation of the instrument.
Data can be selected by Spectrometer/Crystal pair, X-ray element and line, HV, Standard, Calibration Type and Method (as appropriate to the graph). As well as the intensity of a pure element standard (I pure), the background count rate (“Back”) can also be plotted. Finally, enabling ‘Show Efficiency’ displays the semi-quantitative efficiency curve calculated for each spectrometer.
Some examples:
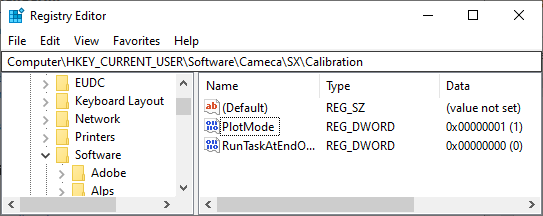
*If the graphing button does not appear in the Calibration Utility window, check this registry entry:
Efficiency Acquisition
Before using Expert System features, including WDS Semi Quantitative analysis, calculated standard intensities, and simulated WDS spectra, the efficiencies of all WDS spectrometers must be calibrated for your instrument.
The efficiency (and FHWM) calibrations should to be performed, at a minimum, during machine installation. Further calibrations should be done if modifications of the crystals or spectrometers occurs, or if the included verify acquisition shows a deviation of the efficiency values.
Data are stored in two calibration files:
effic.dat: contains the calibration values for the spectrometer efficiencies
fwhm.dat: contains the calibration values for the full width at half maximum (FWHM) of the x-ray peaks
A third file exists: verif.dat which is used to verify that the efficiency values are still correct.
These three files are stored in the folder C:\Cameca SX Shared\.
1) Before acquisition, update the Verify 1 and Verify 2 positions in the Configuration->Stage panel. When a crystal is changed during the acquisition, the program will use these positions to ‘verify’ the crystal.
The Verify 1 position will be used for all crystals except (L)PC2 and (L)PC3. Most commonly, this is the position of the ‘andradite’ standard on the CAMECA-supplied block_1. Move to the sample, then click on the Save button. You do not need to unlock the Configuration program to make the update.
The Verify 2 position will be used for (L)PC2 and (L)PC3 and is usually B (boron). Move and Save this position.

The acquisition of the data files is automated with the program SemiQtAcquisition9.exe, which can be found in the C:\Program Files(x86)\Cameca SX\bin folder.
Launch the program and select ‘Efficiency’.
The initial list shows all the elements and crystal combinations which will be acquired.

By default, the measurements are made on the standards in Block_1 delivered by CAMECA with the microprobe. It is possible to select other Blocks in the program.
If you open the Properties for each crystal/element pair, you will see the standard that will be measured, along with its stage position. Use the controls to move to the standard and update its position. It is not required to measure all elements listed. For example, if you do not wish to measure a certain element (poor standard condition, for example), you can delete it from the list. The only way to restore an element is to restart the program.
You can also measure some elements in one session, then return to the program to complete the remaining acquisitions.
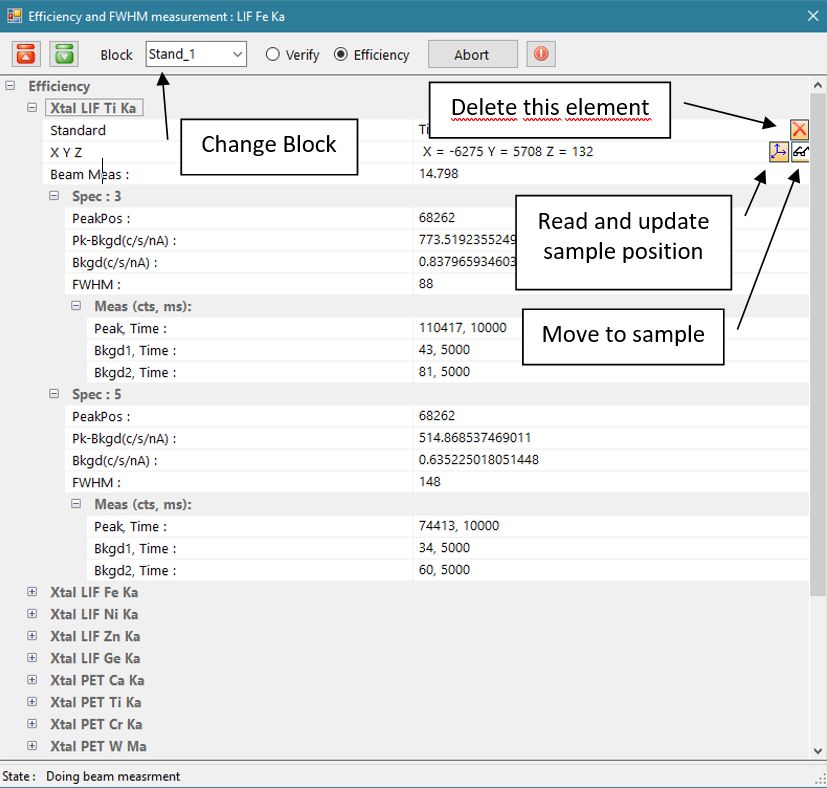
This program is dedicated to verify the calibration of the efficiency measurements. It makes measurements on the andradite sample, on one x-ray line per crystal (Fe K for LiF and LLiF, Ca K on PET and LPET, Si K on TAP, OK on PC0, PC1, PC2).
If there is a deviation between the values in verify.dat and the value in effic.dat, the software displays a warning message recommending acquisition of a new effic.dat file.
At the start of acquisition, any previous data files are copied to:
efficbak.dat
fwhmbak.dat
After acquisition, the data from these old files are merged with the new data.
You can edit and check the values of effic.dat, fwhm.dat and verify.dat in Notepad.
It is a good idea to check the contents of these files for any errors which may have occurred during acquisition.
Note: the M-line x-rays are only measured for their FWHM values and will not appear in the effic.dat file.
Contact

Our support team is ready to help you
FAQ

Answers to some common questions from SX users
Troubleshooting

Quickly search for solutions to instrument issues