Interf Check
The interference check utility generates a list of potential X-ray line overlaps, based on user selection of elements from a periodic table display. The list is helpful for choosing analytical lines, WDS crystals and background offsets. The utility may be used to find X-ray line overlaps in any set of elements. To evaluate line overlaps in an analytical protocol, select all elements contained in the target samples and calibration standards, to be aware of potential interferences in quantitative analysis and calibration.
Definitions
The Interference Check program uses Bragg’s Law, including a correction for refraction in the diffracting device, to calculate X-ray line positions from an internal X-ray database:
n*λ = 2d*sinϴ*(1-k/n2)
n is the order of diffraction,
λ is the wavelength of the X-ray line,
2d is the interplanar spacing of the diffracting crystal or multilayer device,
ϴ is the angle of diffraction,
k is the refraction factor of the diffracting crystal or multilayer device.
CAMECA spectrometers are geared in “sinϴ steps”, where 1 step is equal to a sinϴ difference of 0.00001, or 1*10-5. Thus, a spectrometer position of 60000 is equal to a sinϴ value of 0.60000. The range of a standard spectrometer is from ~0.23 to ~0.84 sinϴ, while the extended range spectrometer has a range of ~0.23 to ~0.93 sinϴ
The values of 2d and k for each crystal or multilayer device are taken from the Configuration program, Crystal panel.
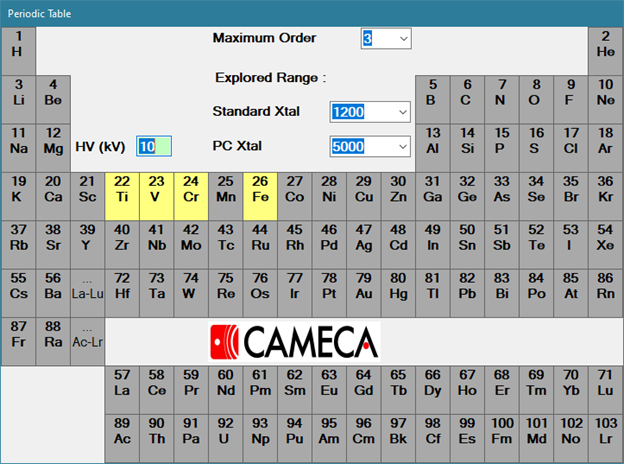
Selection of elements and filters
To select an element, click on the element in the periodic table to select the commonly used X-ray line for that element at the selected beam voltage. To choose another line (less commonly used or from another transition level), RMB click on the element to access a drop down menu and choose the desired line, then LMB again on the element to select the element and new line in the list.
The output may be filtered by beam accelerating voltage, maximum order and explored range. The HV (kV) field (beam voltage) is automatically read from the column, or may be entered manually, and sets a limit on the maximum X-ray excitation energy. X-ray lines with an excitation energy greater than the beam voltage will not be shown. Maximum Order limits the display to the first n orders of X-ray lines. The Explored Range sets the boundaries, in the number of spectrometer steps around the analytical X-ray line, within which potential interferences will be displayed.
Output
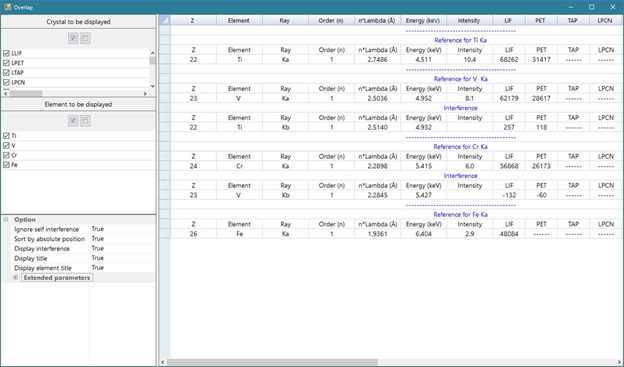
As elements are selected, results appear in a separate ‘Overlap’ window.
The following data is displayed: Atomic number (Z), Element name, X-ray name, X-ray order (n), n*Lambda (Å), X-ray energy (keV), Theoretical intensity (arbitrary units, dependent on HV), and Position of the X-ray line, in sinϴ units.
For each analytical X-ray line (Reference), the position shown is the absolute position of the X-ray line on the spectrometer for each crystal.
After each reference X-ray line, potential X-ray line Interferences are shown in relative positions from the reference line, in sinϴ units. For example, a value of 600 means that the interfering line is located 600 steps away from the reference line, at a higher sinϴ position. Negative values indicate that the interfering line is at a lower sinϴ position, relative to the reference line.
In the output window, it is possible to select/deselect display of crystals and elements by using the checkboxes on the left panels.
Options
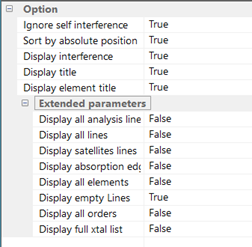
Sort by absolute position: If True, interferences are sorted by absolute difference in wavelength from the reference analytical line.
Display interference: Enable/disable display of interfering lines.
Display title: Enable/disable section headers.
Display element title: Enable/disable column headers.
Display all lines: Enable/disable display of all lines for the selected elements.
Display satellite lines: Enable/disable display of satellite lines.
Display absorption edges: Enable/disable display of absorption edges.
Display all elements: Enable/disable display of all elements in the database.
Display empty Lines: Enable/disable display of lines not accessible on any crystal.
Display all orders: Enable/disable display of orders > 1 (the number of orders shown is the Maximum Order shown in the Periodic Table window)
Display full xtal list: If False, show only crystals available on this EPMA. If True, show all crystals available on CAMECA EPMA (some are legacy devices).
The interference utility is a useful search tool for X-ray overlaps. However, it is possible to be overwhelmed by the number of potential overlaps, especially when working with elements of higher atomic numbers, which generate many emission lines. Here are some general guidelines:
- If the interfering line is from an element of very low concentration in the sample (or standard), there is less concern than if the interfering element is of high concentration.
- Interfering lines of higher order (n > 1) will be much lower in intensity than first order lines (n = 1).
- Interfering lines with n > 1 can be suppressed by proper use of PHA (Pulse Height Analysis) discrimination. Lines with n = 1 cannot be suppressed with PHA.
- Choosing a background offset position greater than that of an interference position does not necessarily include the interfering line in the background counts. For example, if there is an interfering line at -600, choosing a background offset of -1000 does not mean that counts from the interfering line at -600 will be included in the background measurement at -1000. WDS is not (usually) an integrating technique, but instead collects counts at discrete wavelength positions.
- If there is a major overlap on an analytical peak, consider using another crystal (e.g., LiF instead of PET for V Ka) or another analytical line (e.g., V Kb instead of V Ka).
- If a calibration standard contains an element that will not be included in the quantitative analysis of the unknown samples, it is not necessary to specify an analytical line for that element. However, it is still important to select the element itself, in case there is an X-ray overlap that could affect calibration on the standard.
- How close is too close for an interfering line? The answer will vary with the diffracting crystal, the concentration of the interfering line, and the expected concentration of the sample. Anything with an offset of less than a few hundred steps should be carefully considered.
- There is a peak overlap correction available in the Quantitative analysis software that can mathematically suppress interferences for all orders.
- For trace element analysis, the Check Interference program is a good first step. Further evaluation should be made with real spectra acquisition and quantitation on blank samples.
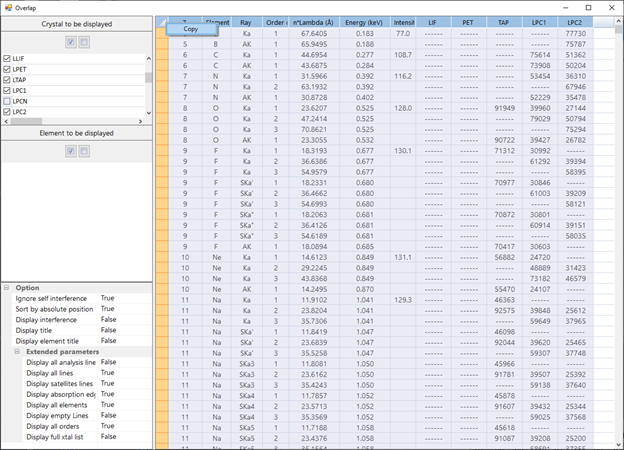
It is possible to create your own X-ray line database, which can be sorted or filtered in third-party software, such as Excel®.
In this example,
- All elements are selected
- All lines, orders, satellite lines, and absorption edges are displayed
- Empty lines are not displayed
- The data can be copied (RMB click on upper left corner, then Copy) and paste into another program
- Note: The listing is dependent on the beam voltage entered in the Periodic Table window. If using the table at lower beam voltages, remember to check the X-ray line energy to see if it will be excited by the beam. Conversely, some lines will not show in the table if the actual beam voltage is higher
Nomenclature
Conversion of output display to Siegbahn notation.
|
Analytical lines |
Other lines |
Other lines |
|||||
|
Ka |
Kα1 |
Lb2 |
Lβ2 |
M1N2 |
M1-N2 |
||
|
Kb |
Kβ1 |
Lb3 |
Lβ3 |
M1N3 |
M1-N3 |
||
|
La |
La1 |
Lb4 |
Lβ4 |
M2N1 |
M2-N1 |
||
|
Lb |
Lβ1 |
Lb5 |
Lβ5 |
M2N4 |
M2-N4 |
||
|
Ll |
Ll |
Lb6 |
Lβ6 |
M2O4 |
M2-O4 |
||
|
Ma |
Mα1 |
Lb7 |
Lβ7 |
M3N1 |
M3-N1 |
||
|
Mb |
Mβ |
Lb8 |
Lβ8 |
M3N4 |
M3-N4 |
||
|
Lb9 |
Lβ9 |
M3O1 |
M3-O1 |
||||
|
Absorption edges |
Lb10 |
Lβ10 |
M3O4 |
M3-O4 |
|||
|
AK |
A K |
Lc |
Lγ1 |
M4O2 |
M4-O2 |
||
|
AL1 |
A L1 |
Lc2 |
Lγ2 |
Satellite lines |
|||
|
AL2 |
A L2 |
Lc3 |
Lγ3 |
SKa' |
SKα' |
||
|
AL3 |
A L3 |
Lc4 |
Lγ4 |
SKa'' |
SKα'' |
||
|
AM1 |
A M1 |
Ln |
Lη |
SKa3 |
SKα3 |
||
|
AM2 |
A M2 |
Mc |
Mγ |
SKa4 |
SKα4 |
||
|
AM3 |
A M3 |
Mz |
Mζ |
SKa5 |
SKα5 |
||
|
AM4 |
A M4 |
Mz2 |
Mζ2 |
SKa6 |
SKα6 |
||
|
AM5 |
A M5 |
SKb' |
SKβ' |
||||
Contact

Our support team is ready to help you
FAQ

Answers to some common questions from SX users
Troubleshooting

Quickly search for solutions to instrument issues