Recorder
Overview
The Recorder is the second application available from the Utilities tab and can be activated by clicking on the ‘Recorder’ button or via the following path.
C:\Program Files (x86)\Cameca SX\bin folder\ Recorder9.exe
The Recorder allows service engineers to monitor all raw data gathered on the instrument, whether it concerns the counts on each individual spectrometer, the current read by the Faraday cup, the sample or delivered by the electron gun for instance. Stored information can be recalled by opening a recorder description file with the ‘.rec’ extension using the ‘open file’ icon, as shown below.
Current functions
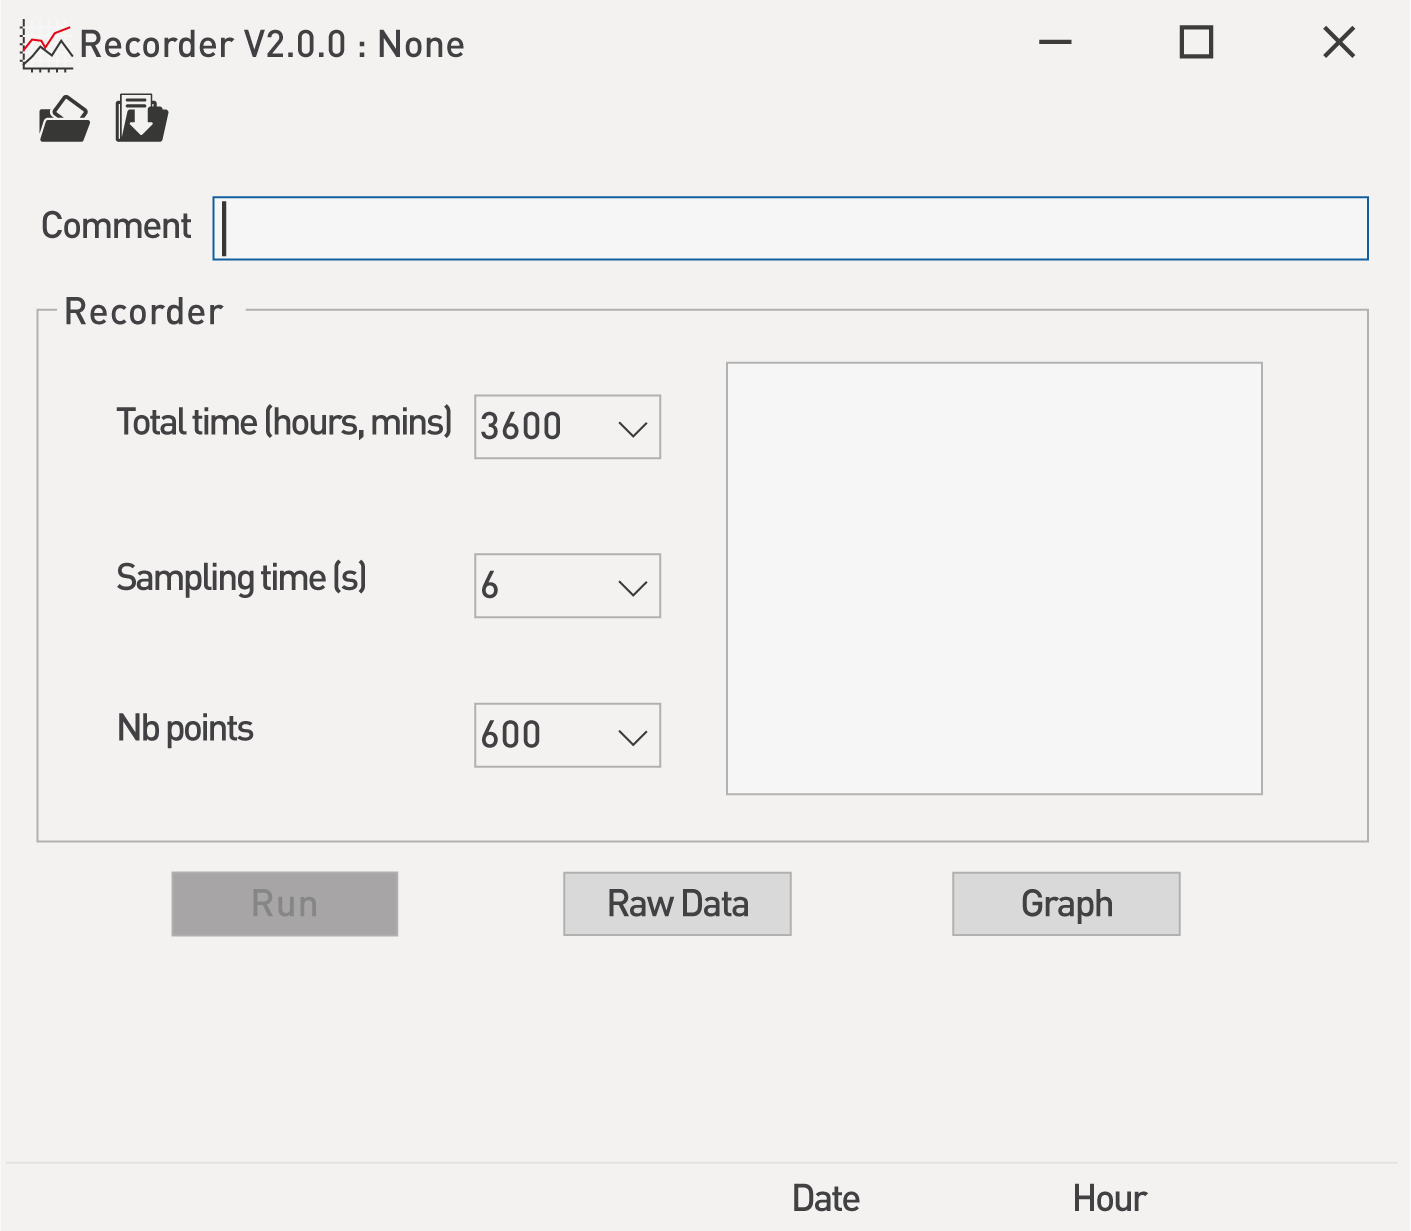
‘Total time’, which represents the monitoring duration, may be defined in hours or mins, knowing that the ‘Sampling time (s)’ will be adjusted according to the ‘Nb points (Number of points)’. By the way, these two last parameters, the ‘Sampling time (s)’ and the ‘Nb points (Number of points)’ interact and vary with the ‘Total time (hours, mins).
For each parameters, values can be chosen through a drop-down list or directly typed.
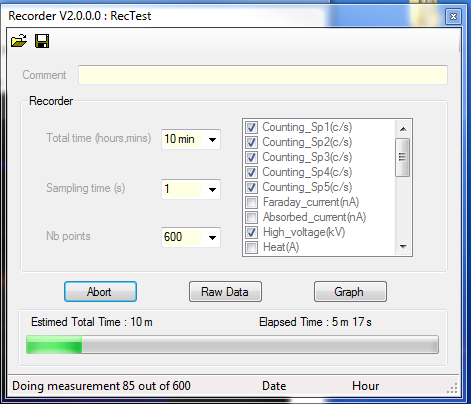
Once all these parameters are selected, and a test is ready to be executed, the defined sequence can be saved through the save icon, and launched clicking the ‘Launch’ button.
During the measurement, the ‘Total time’ as well as the ‘Elapsed time’ are indicated by a progress bar as shown below.
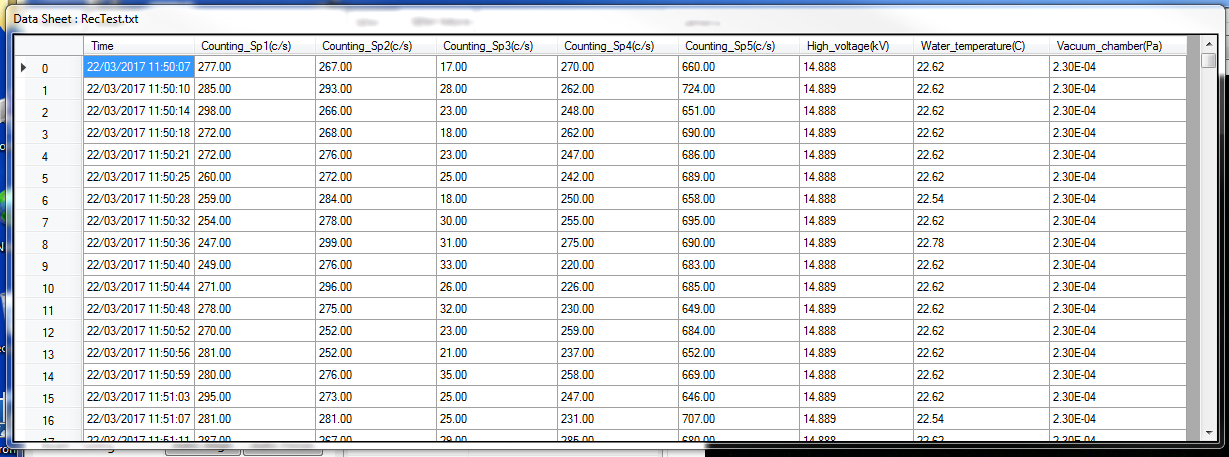
When loading a file or while acquiring a measurement, both raw data and the associated plots can be displayed by clicking on ‘Raw Data’ and ‘Graph’ as shown below.
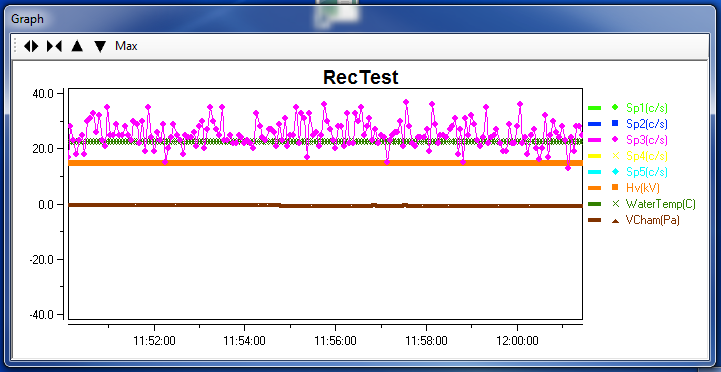
In order to make the most out of the visual aspect of the data, one way would be to adjust the selected graphs using various display options. Both X and Y axes can be enlarged or shrunk, while the ‘Max’ button automatically scales the graphs to encompass the maximum values as exposed below.
A manual setting of the X or Y scale can be reached through a double-click on each of the axes. The ‘Axis Configuration’ window appears and allows adjustment of the axis scale by typing the desired values. For display purposes, both scales can also be hidden by unselecting the ‘Visible’ checkbox.
An additional level of control is provided by opening the Curves Configuration window by a double-click on any of the plots displayed. Hence, as highlighted below, each plot can be individually set for Name, Line Pattern, Shape Pattern or Bar Pattern, with tunable width and color. The Scale Factor can be modified and the Area under the plot can be Filled or left untouched.
Contact

Our support team is ready to help you
FAQ

Answers to some common questions from SX users
Troubleshooting

Quickly search for solutions to instrument issues