SX-Result – Overview
This program manages the display as well as the processing of the acquired data. Again, data originating from any kind of application (Spectrum, Table of Values, Images, Profiles…) are handled in a single responsive window governed by a unique ergonomic principle. This window can work as a multi-document interface through tab navigation, allowing several acquisitions to be displayed simultaneously.
Each data file is divided in two parts: a ‘header’, that contains information about the acquisition conditions, and the results. The content of the panels can be modified easily by the user, allowing all the requested information to appear.
This program allows export facilities compatible with MS-OfficeTM and features built-in access to ExcelTM.
How to access to SX-Results
Like the other PeakSight main program, SX-Results can be opened from the SX-AppBar under the Analysis module or from its corresponding source file under the following folder:
C:\Program Files (x86)\Cameca SX\bin
The SX-Results module can also be quickly accessed through the small analysis shortcut icon located on the Windows® Taskbar.
The following sections will detail the various options given to the users to read and process the results files.
The Sx-Results Window Organization
The SX-Results window is divided into six parts as follows:
1. Menu, shortcuts, and project bar
2. Data selection
3. Miscellaneous tools
4. Properties
5. Result viewer
6. Processing tools

Menu, shortcuts and project bar
The first general menu in the Sx-Results window possesses 4 entries: File, Panel, Window and Tools. Some function can be quickly accessed through their corresponding shortcut icons. The user can define specific projects, samples and methods for each analytical session. All analyses will be located under the \SXPC folder.
‘File’ Menu
Open
Users have the opportunity to open any type of existing files whether they pertain to WDS spectra, Images & Profiles, Calibration and/or Quantification.
Save
Users have the opportunity to save all the current data files whether they pertain to WDS spectra, Images & Profiles, Calibration and/or Quantification. Once a file is created, it can be saved under an automatically assigned name by clicking on the ‘Save’ option or by applying the Ctrl+S shortcut.
Save As
Saves the current file under a new name.
Recent Files
List of recently opened files.
‘Panel’ Menu
The panel menu rules the general organization of the SX-Results window. All the sub-windows can be resized and moved from the initial layout.
Show
Allows display of specific panel on the SX-Results window like ‘Selection’, ‘Properties’, ‘Misc’, ‘Processing’.
Show All
Display all the panels.
Hide All
Hide all the panels except the results viewer.
Auto Hide All
Collapse the ‘Selection’, ‘Properties’ & ‘Misc’ panels to the left side of the SX-Results window.
Reset Current Layout to Default
Restore the initial arrangement and size of all the windows.
Title
Display the name of the current layout. As the SX-Results windows is divided into many tabs and panels, users have the ability to modify general organization. When the layout is customized, users can save it as ‘Layout1’, ‘Layout2’, ‘Layout3’ or ‘Layout4’ just by typing it’s name into the title text box. Drag and drop function can be used to change windows position.
‘Window’ Menu
These functions are common to the WindowsTM environment. The bottom list allows the desired data to be selected quickly.
‘Tool’ Menu
Move to X, Y and Z
Only for Quanti. Adjusts to move X, Y and Z to a given data position by double-clicking on the data set
Move to X and Y
Only for Images. Adjusts to move X and Y to a given data position by double-clicking on an image
Move to Center
Only for Images. Moves to the center of a given image by double-clicking on it.
Move Spectrometer
Only for spectrometer. Select then add absolute position cursor in the graph. Double click on the cursor to move the spectrometer to a given position.
Options
Opens a menu with various options for ‘Quanti’, ‘Calibrations’, ‘Geo’, ‘Image’, ‘Spectrum’, ‘Profiles’.
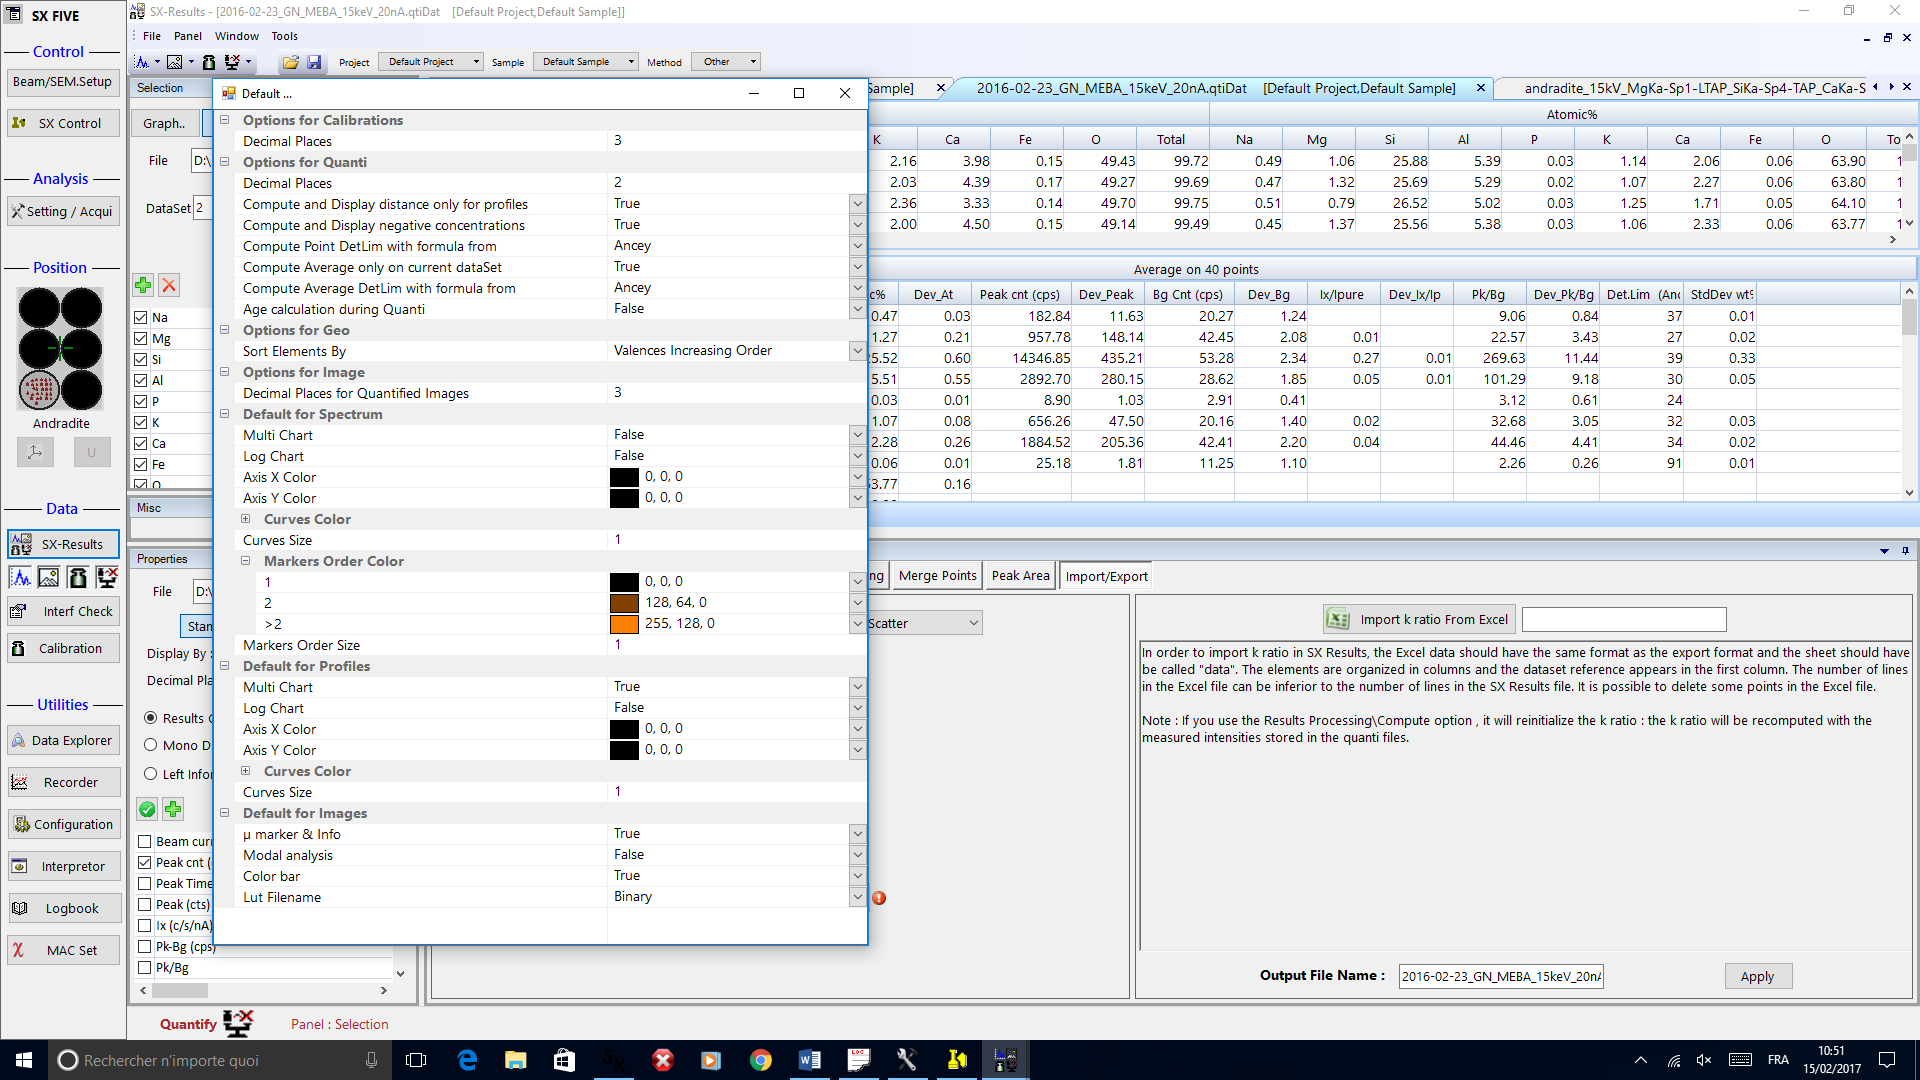
Under Quanti options, When ‘Compute and display negative concentration’ is tuned on true, values are displayed even if the P-B value are lower than 0. A negative value can tracks a problem with background definition or overlaping effect. The ‘Age calculation during Quanti’ option makes age calculation automatic during measurement.
Shortcuts Icon Menu
Most of the options described above can also be reached through several icons as shown below:
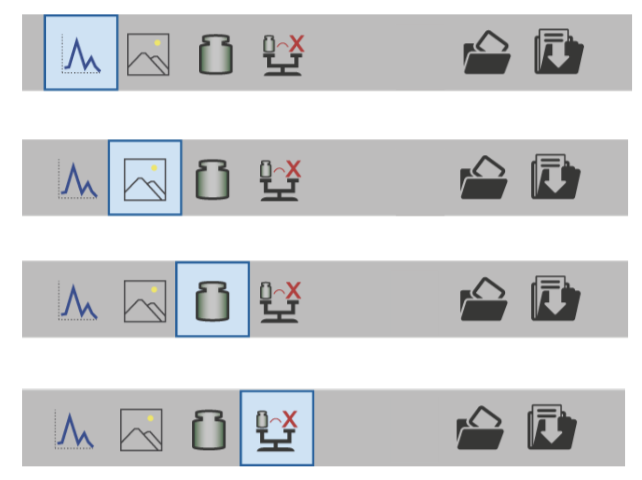
To open an existing file users select the desired type of data among WDS Spectra, Image & Profile, Calibration or Quantification. The selected type of data is highlighted with a blue frame. Then, one click on ‘Open’ icon display a file browser dialog box. One can also use new features and import any compatible file type by dragging and dropping them from the Windows Explorer.
Project bar
Users may name their Project and Sample which will be saved in specific directories. They can also define a general ‘Method’ for their analysis like ‘Geology’, ‘Metallurgy’ or ‘Sulphides’.
![]()
All the SX projects are stored inside:
\SXPC\Project\Sample
Related Article
SX-Result WDS
Reading Duration 16min
WDS Spectra are one of the most efficient ways to explore a sample’s chemical composition. The resulting spectrum has an excellent spectral resolution and contains thousands of single measurements. This database can be used to identify the occurence of chemical elements within a given sample and also get semi-quantitative analysis with or without calibration.
SX-Results – Images
Reading Duration 36min
Images are some of the key data that can be obtained with an EPMA. PeakSight 6.2 gives the users a new way to analyze and exploit these specific data. Chemical mapping can be executed for a maximum of 20 different elements.
SX-Results – Calibration
Reading Duration 2min
Calibration is the key parameter of any quantification experiment. To have high confidence in the quantitative analysis, fine calibration files are required. The result display is divided into three tables (datas, data and statistics) and one graph (P-B).
SX-Results – Quanti
Reading Duration 9min
Quantification is the last and most important data-type that can be investigated through EPMA experiments. As quantified analysis requires a calibration process, these data need a strong analytical constraint to make them usable as scientific results.
Contact

Our support team is ready to help you
FAQ

Answers to some common questions from SX users
Troubleshooting

Quickly search for solutions to instrument issues