SX-Results – Calibration
Overview
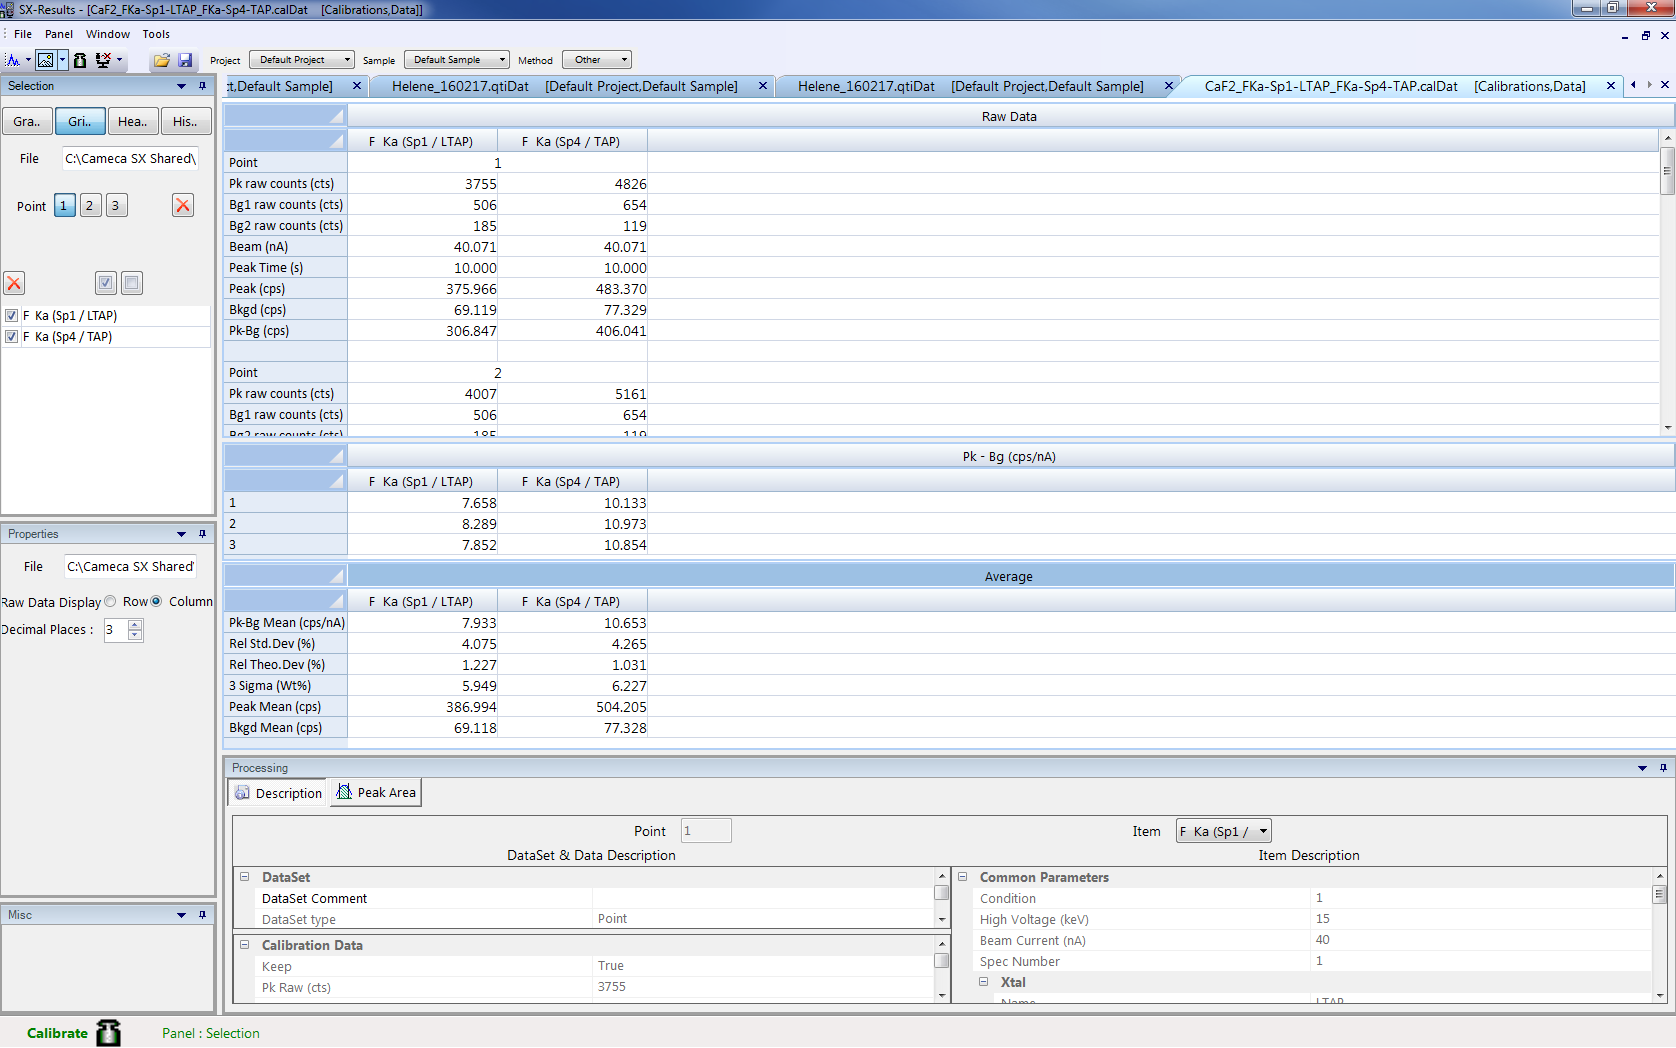
Calibration is the key parameter of any quantification experiment. To have high confidence in the quantitative analysis, fine calibration files are required. The result display is divided into three tables (raw data, P-B and average data) and one graph (P-B). In case of eratic analysis during the calibration process, a double click on the erroneous point will delete it.
Description
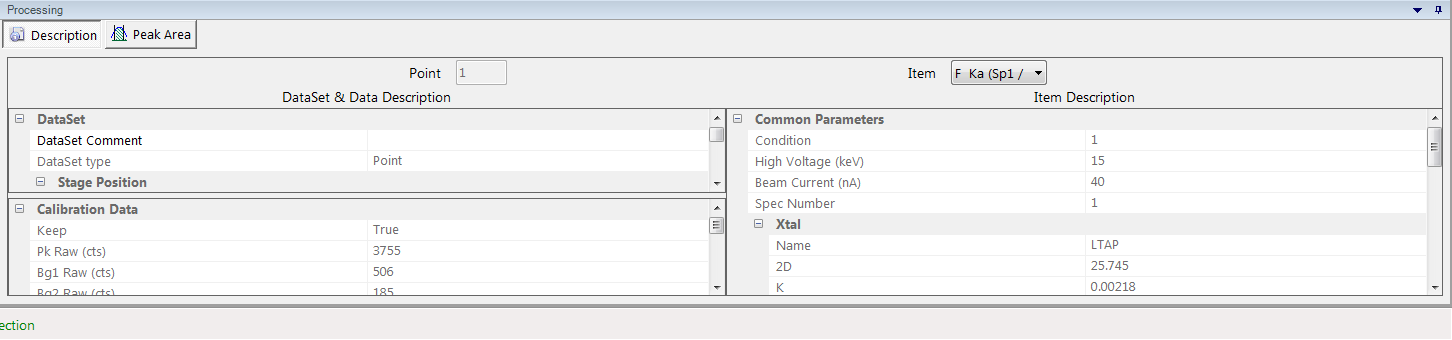
This sub-panel displays all the settings and options defined together with the Calibration settings file through the SX-SAB – Settings. The ‘Item’ drop-down list allows the select of the desired DataSet. Most of the information are read-only but some of them can be modified like ‘DatasSet Comment’ or‘Stage Position’. Refer to the SX-SAB – Calibration Settings for further information.
Peak Area
Element calibration can be ran according to two methods: by peak intensity or by peak area measurement. The latter requires a definition of the surface which must to be considered for further calculation. The ‘Peak Area’ process allows the define of a reference geometry for a given calibration dataset. Only data acquired with the peak area method can be processed with this tool.
Users have to define ‘Name’, background ranges (‘Bg Ranges’) and then click on the ‘Apply’ button to use the new peak area definition. Refer to the SX-SAB – Peak Area Mode for further information.

Related Article
SX-Result – Overview
Reading Duration 10min
This program manages the display as well as the processing of the acquired data. Again, data originating from any kind of application (Spectrum, Table of Values, Images, Profiles…) are handled in a single responsive window governed by a unique ergonomic principle. This window can work as a multi-document interface through tab navigation, allowing several acquisitions to be displayed simultaneously.
SX-Result WDS
Reading Duration 16min
WDS Spectra are one of the most efficient ways to explore a sample’s chemical composition. The resulting spectrum has an excellent spectral resolution and contains thousands of single measurements. This database can be used to identify the occurence of chemical elements within a given sample and also get semi-quantitative analysis with or without calibration.
SX-Results – Images
Reading Duration 36min
Images are some of the key data that can be obtained with an EPMA. PeakSight 6.2 gives the users a new way to analyze and exploit these specific data. Chemical mapping can be executed for a maximum of 20 different elements.
SX-Results – Quanti
Reading Duration 9min
Quantification is the last and most important data-type that can be investigated through EPMA experiments. As quantified analysis requires a calibration process, these data need a strong analytical constraint to make them usable as scientific results.
Contact

Our support team is ready to help you
FAQ

Answers to some common questions from SX users
Troubleshooting

Quickly search for solutions to instrument issues