SX-Results – Quanti
Overview
Quantification is the last and most important data-type that can be investigated through EPMA experiments. As quantified analysis requires a calibration process, these data need a strong analytical constraint to make them usable as scientific results.
Description
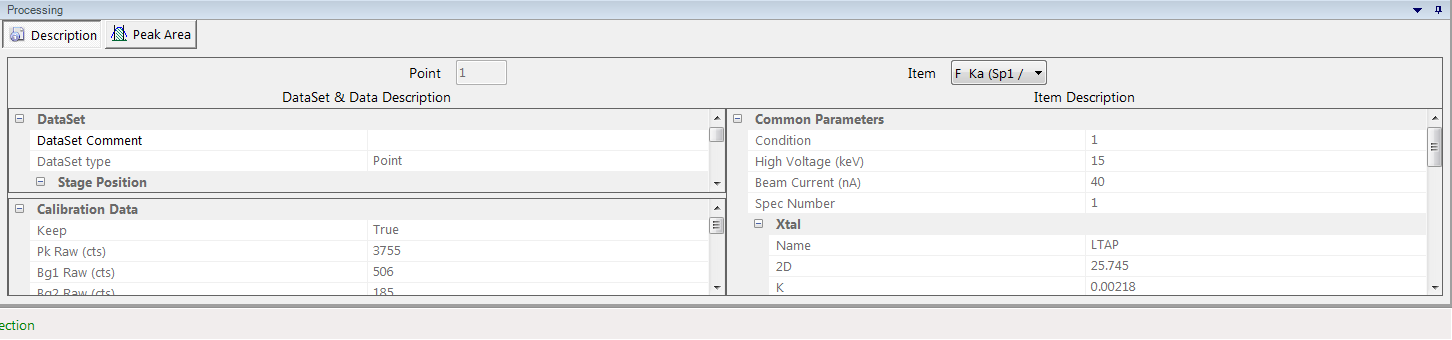
This sub-panel displays the settings and options defined together with the Calibration settings file through the SX-SAB – Settings. The ‘Item’ drop-down list allows the user to select the desired DataSet. Most of the information are read-only but some of them can be modified like ‘DatasSet Comment’ or ‘Stage Position’.
Refer to the SX-SAB – Quantify Settings for further information.
Quantification
The Quantification sub-panel allows the user to modify the quantification options after the quantification setting definition. Parameters are exactly the same and all the required explanation can be found in the SX-SAB – Quantification Analysis section of this user guide. The modification of any quantification option enables the ‘Apply’ button. The DataSet list allows users to select the DataSet which will be affected by the new quantification parameters. Generally, it’s better to affect all the datasets with the same modification.
The ‘Age Quant’ check box give an access to the age calculation option through the U-Th-Pb method.

Calibration
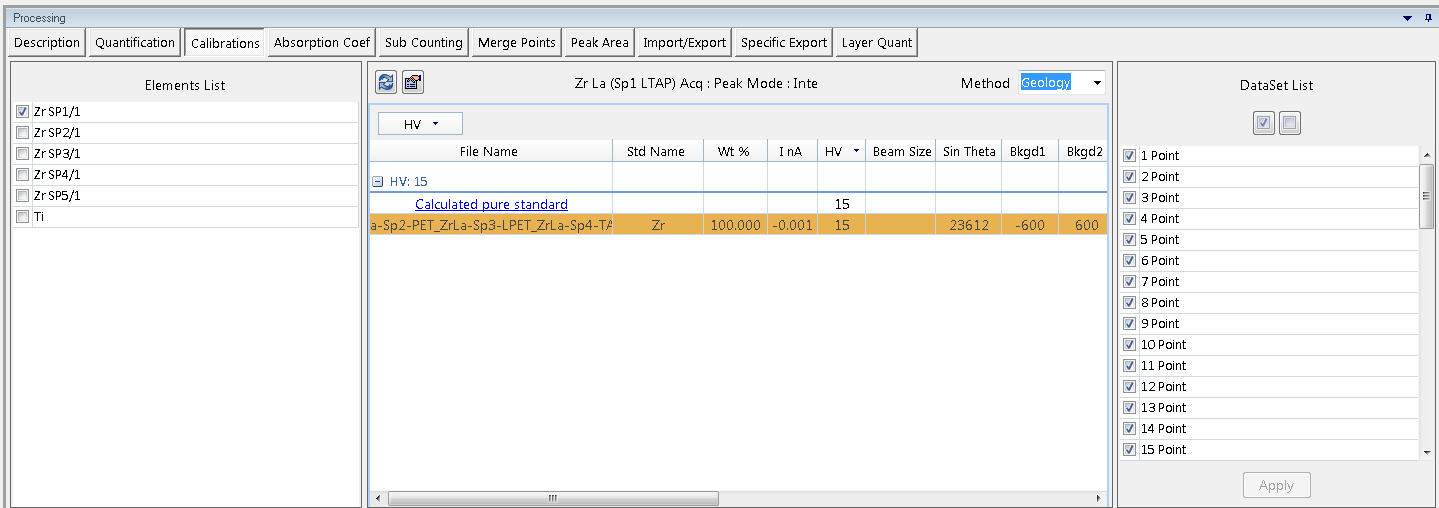
Allows the user to change the attached calibration file of each chemical element. After selecting an element inside the left-side list, users can select a new calibration file for this element inside the list of available calibrations and click on the ‘Apply’ button to start the calculation. As in the Quantification process, the modification can be only applied to selected datasets. Drag and drop column header into the light blue area to sort calibration files.
If a calibration file has not been selected for some elements (Calculated pure standard), a theoretical calibration file is generated according to the ‘Efficiency Acquisition’ data.
The acquisition of the efficiency files is automated with the program SemiQtAcquisition9.exe (in C:\Program Files\CamecaSX\bin folder).
Absorption Coef.
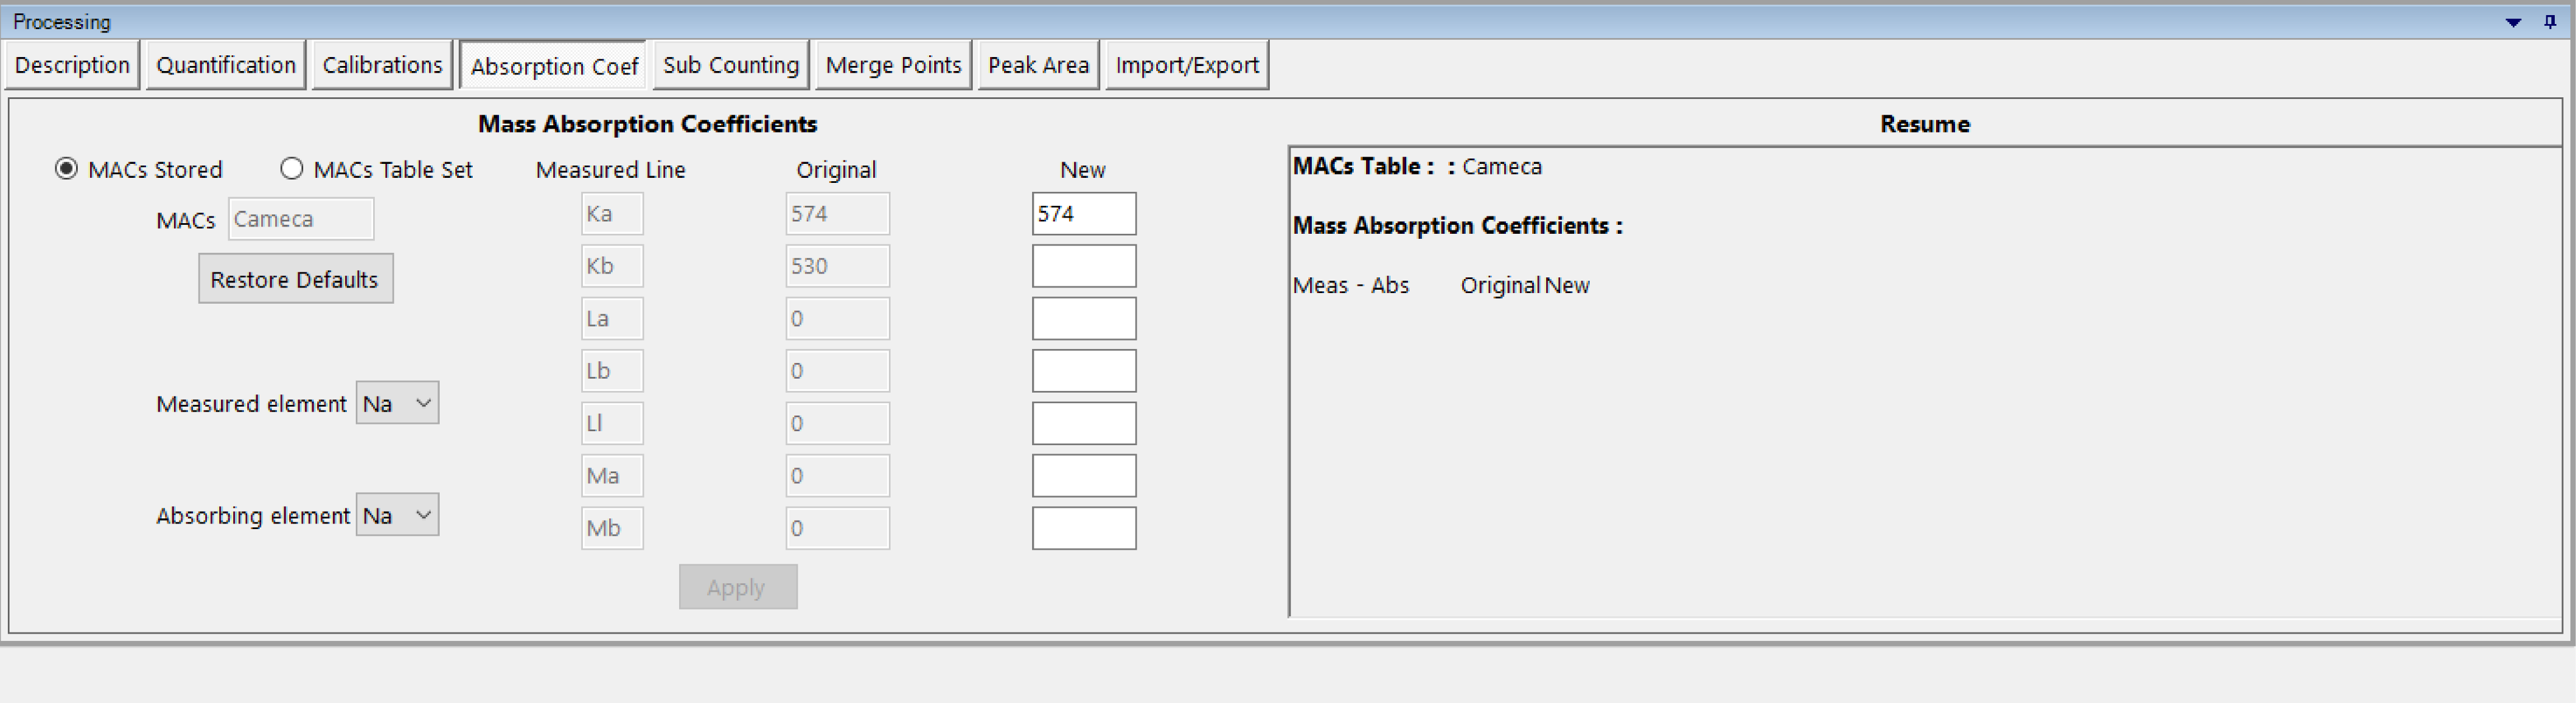
The mass absorption coefficients definition like those described in the MAC Set utility. These modifications are only related to the current file. Refer to the MAC Set utility section for detailed information.
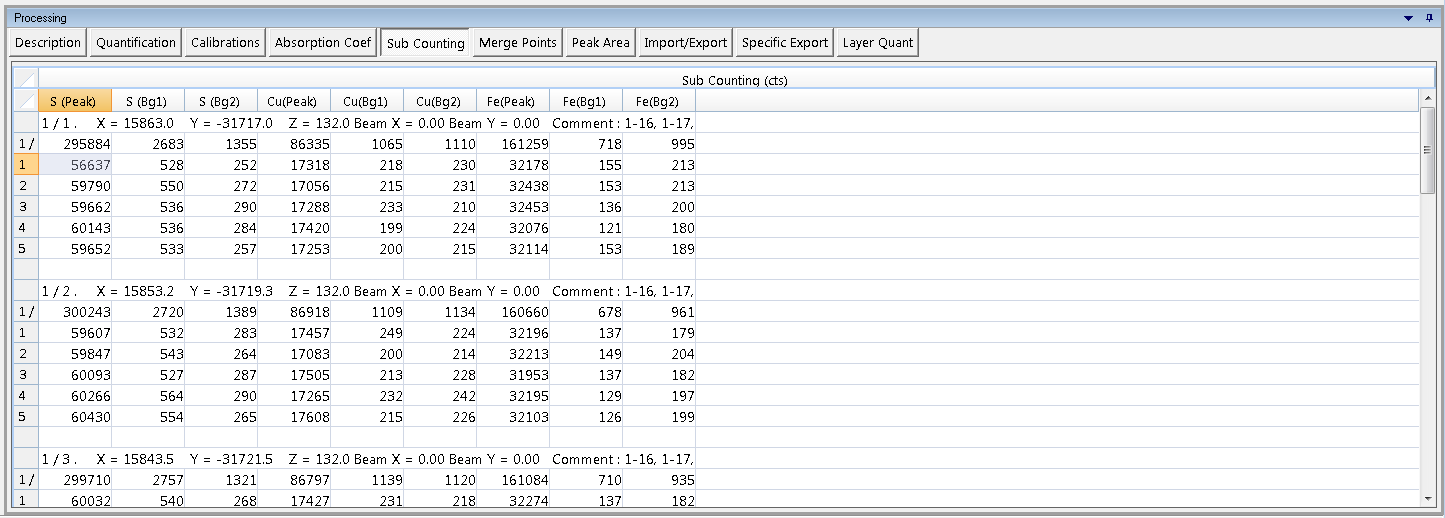
Displays the total counts of each measure for all dataset. The value is the result of an integration of Counts Per Second (cps) and measurement duration (cps x Time(s)).
Various counting configurations can be explored in order to extract information in a more useful way based on materials, trace elements, sensitivity to electron beam, and background shape among few parameters.
If during recipe definition in SX-SAB, the user selected one of the sub-counting option (Time 0 intercept, define sub-counting interval to have a deeper look on the statistics over time, measure all the peaks and then all the bkgds etc.), this option will enable the user to have a detailed overview of all the sub-counting results.
Sub-counting points can be removed from the calculation by double-clicking on them (selected points turned red). By doing that the average all the calculation are updated without the removed points. It enables to see easily the impact on the results. It is also possible to right click on a sub-counting point and apply the Chi2 test. The program will then automatically removed the points according to the Chi2 test (points will appear in red).
Remark: In the case where all the elements of a dataset have not been acquired using sub-counting option, it is necessary to display in the first column an element with sub-counting points. Otherwise the program won’t be able to initiate the calculation and remove sub-counting points.
Merge Points
Merge points is a statistical tool that merges groups of similar analyses in order to increase the counting statistics (e.g., 10 analyses on the same homogenous sample). After typing the ‘Output Name’, users have to select the number of points to merge with the dedicated drop-down list. A Chi2 statistical test is also available. This test will reject some points that are too different from the rest of the sub-dataset. In this case the max number of rejected points can also be set.
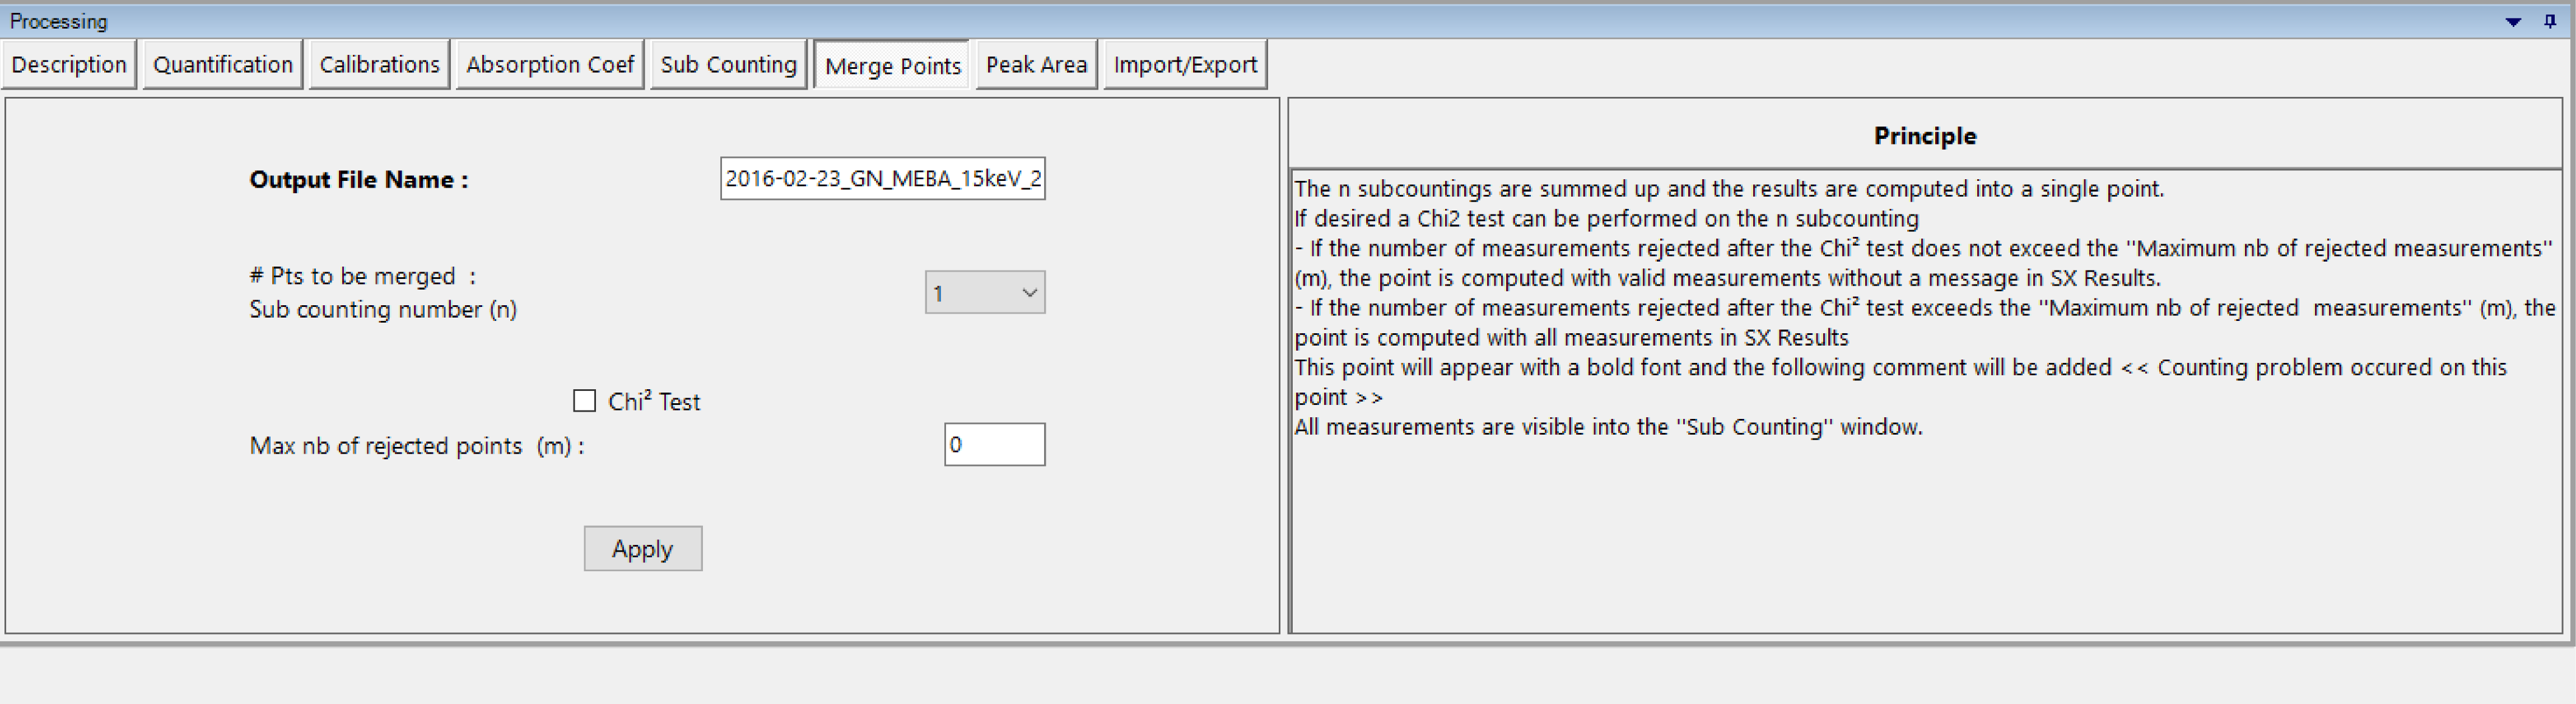
Then, one click on the ‘Apply’ button generates a new Quanti file with point merging. A points-merged file can be processed like any Quanti file.
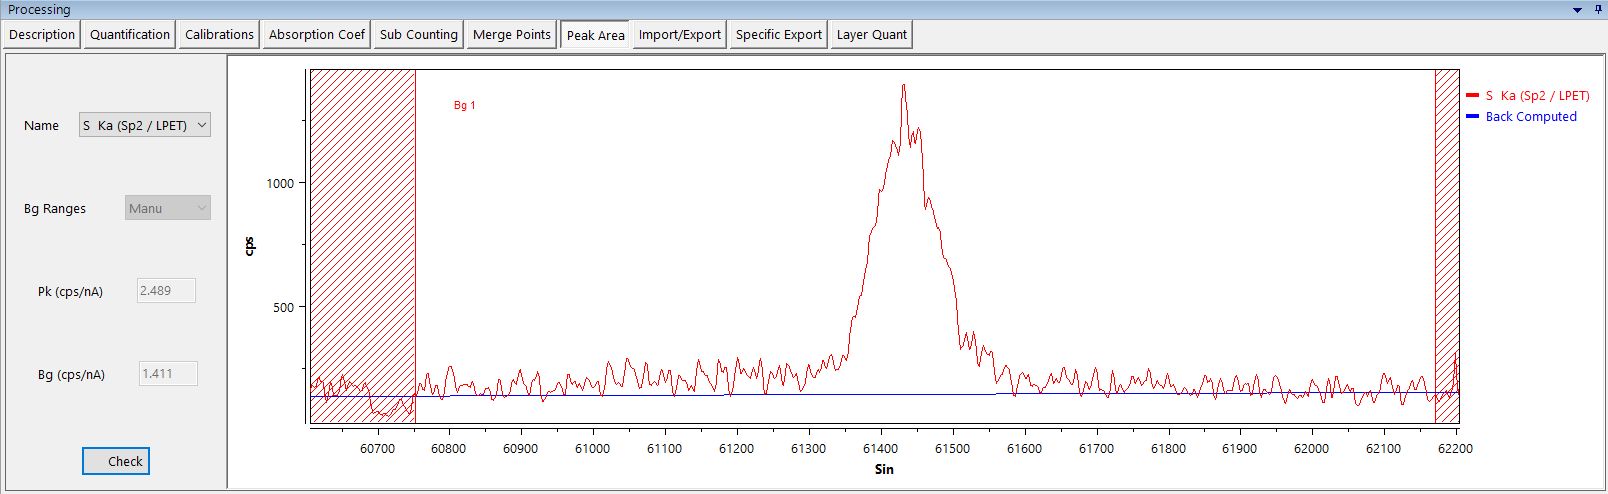
Peak Area
This process measures the peak area of a given dataset when the quantification uses the peak area method instead of the peak intensity. It runs exactly like the Calibration ‘Peak Area’ process.
Import/Export
This panel consists of a tool box to import or export Quanti data. PeakSight supports a native export to MicrosoftTM ExcelTM. Four templates are listed in the ‘Excel file used for exportation’ drop-down list:
- Chartscatter, exports all the data and automatically create a scatter plot on the current Excel sheet
- ChartStandard, exports all the data
- ChartStandardNewPage, exports all the data and automatically create a scatter plot on a new Excel sheet
- ChartStandardPagesMixed, exports all the data and automatically create a scatter plot on a new Excel sheet. This routine merges data sheets and scatter sheets.
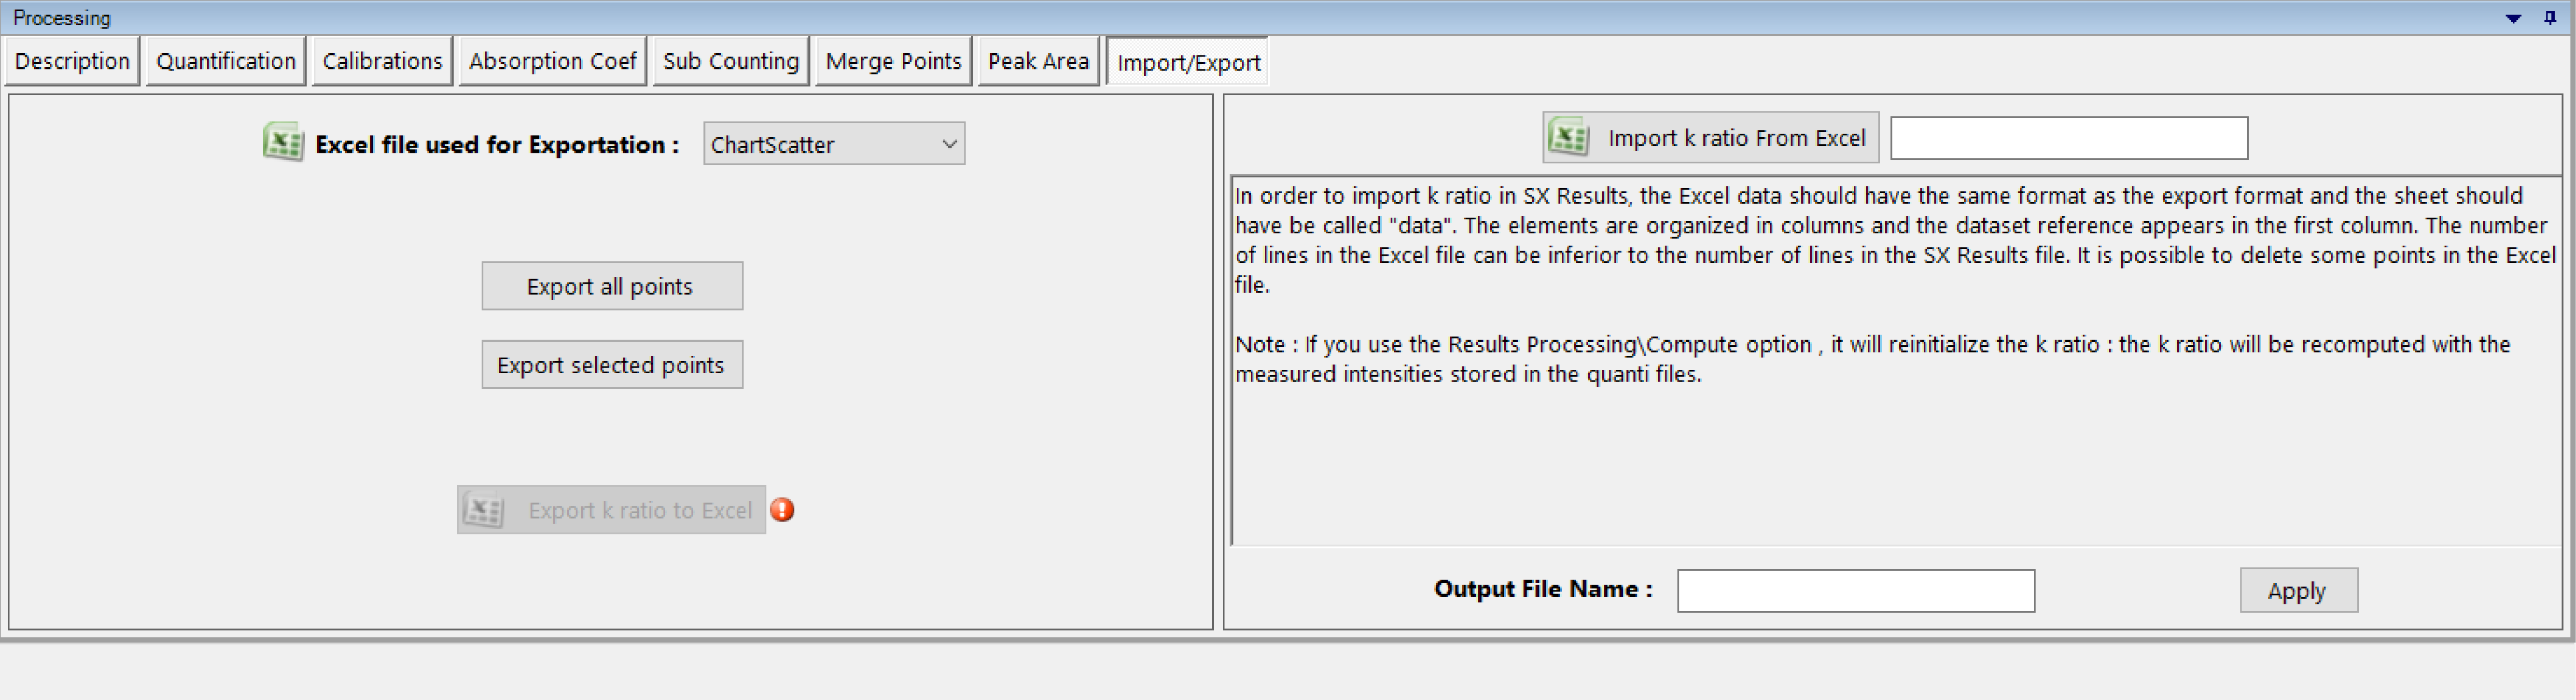
Import K-ratio function allow user to correct measured data with their own factors.
Related Article
SX-Result – Overview
Reading Duration 10min
This program manages the display as well as the processing of the acquired data. Again, data originating from any kind of application (Spectrum, Table of Values, Images, Profiles…) are handled in a single responsive window governed by a unique ergonomic principle. This window can work as a multi-document interface through tab navigation, allowing several acquisitions to be displayed simultaneously.
SX-Result WDS
Reading Duration 16min
WDS Spectra are one of the most efficient ways to explore a sample’s chemical composition. The resulting spectrum has an excellent spectral resolution and contains thousands of single measurements. This database can be used to identify the occurence of chemical elements within a given sample and also get semi-quantitative analysis with or without calibration.
SX-Results – Images
Reading Duration 36min
Images are some of the key data that can be obtained with an EPMA. PeakSight 6.2 gives the users a new way to analyze and exploit these specific data. Chemical mapping can be executed for a maximum of 20 different elements.
SX-Results – Calibration
Reading Duration 2min
Calibration is the key parameter of any quantification experiment. To have high confidence in the quantitative analysis, fine calibration files are required. The result display is divided into three tables (datas, data and statistics) and one graph (P-B).
Contact

Our support team is ready to help you
FAQ

Answers to some common questions from SX users
Troubleshooting

Quickly search for solutions to instrument issues