SX-Control – Camera-SEM
Overview
This panel is divided into 2 sub-panels : Camera and SEM
- Camera
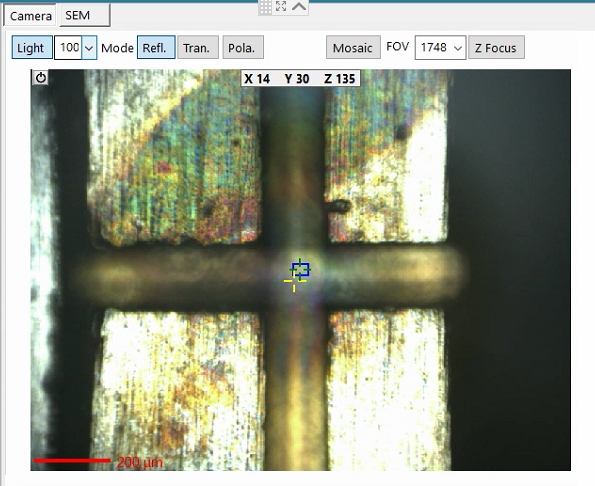
The optical microscope Light can be turned OFF or set up to an intensity level from 0% to 100%.
Left click on ‘Camera’ frame text to display a live video optical image in the Area View window.
The optical microscope can be operated in Transmission or in Reflection mode, and switching from one mode to the other can be achieved by toggling the Refl. or the Tran. Buttons.
The Reflective light is used to position the sample at the correct height for the WDS. The Transmitted light mode is dedicated to the observation of geological samples such as thin sections placed on glass slides.
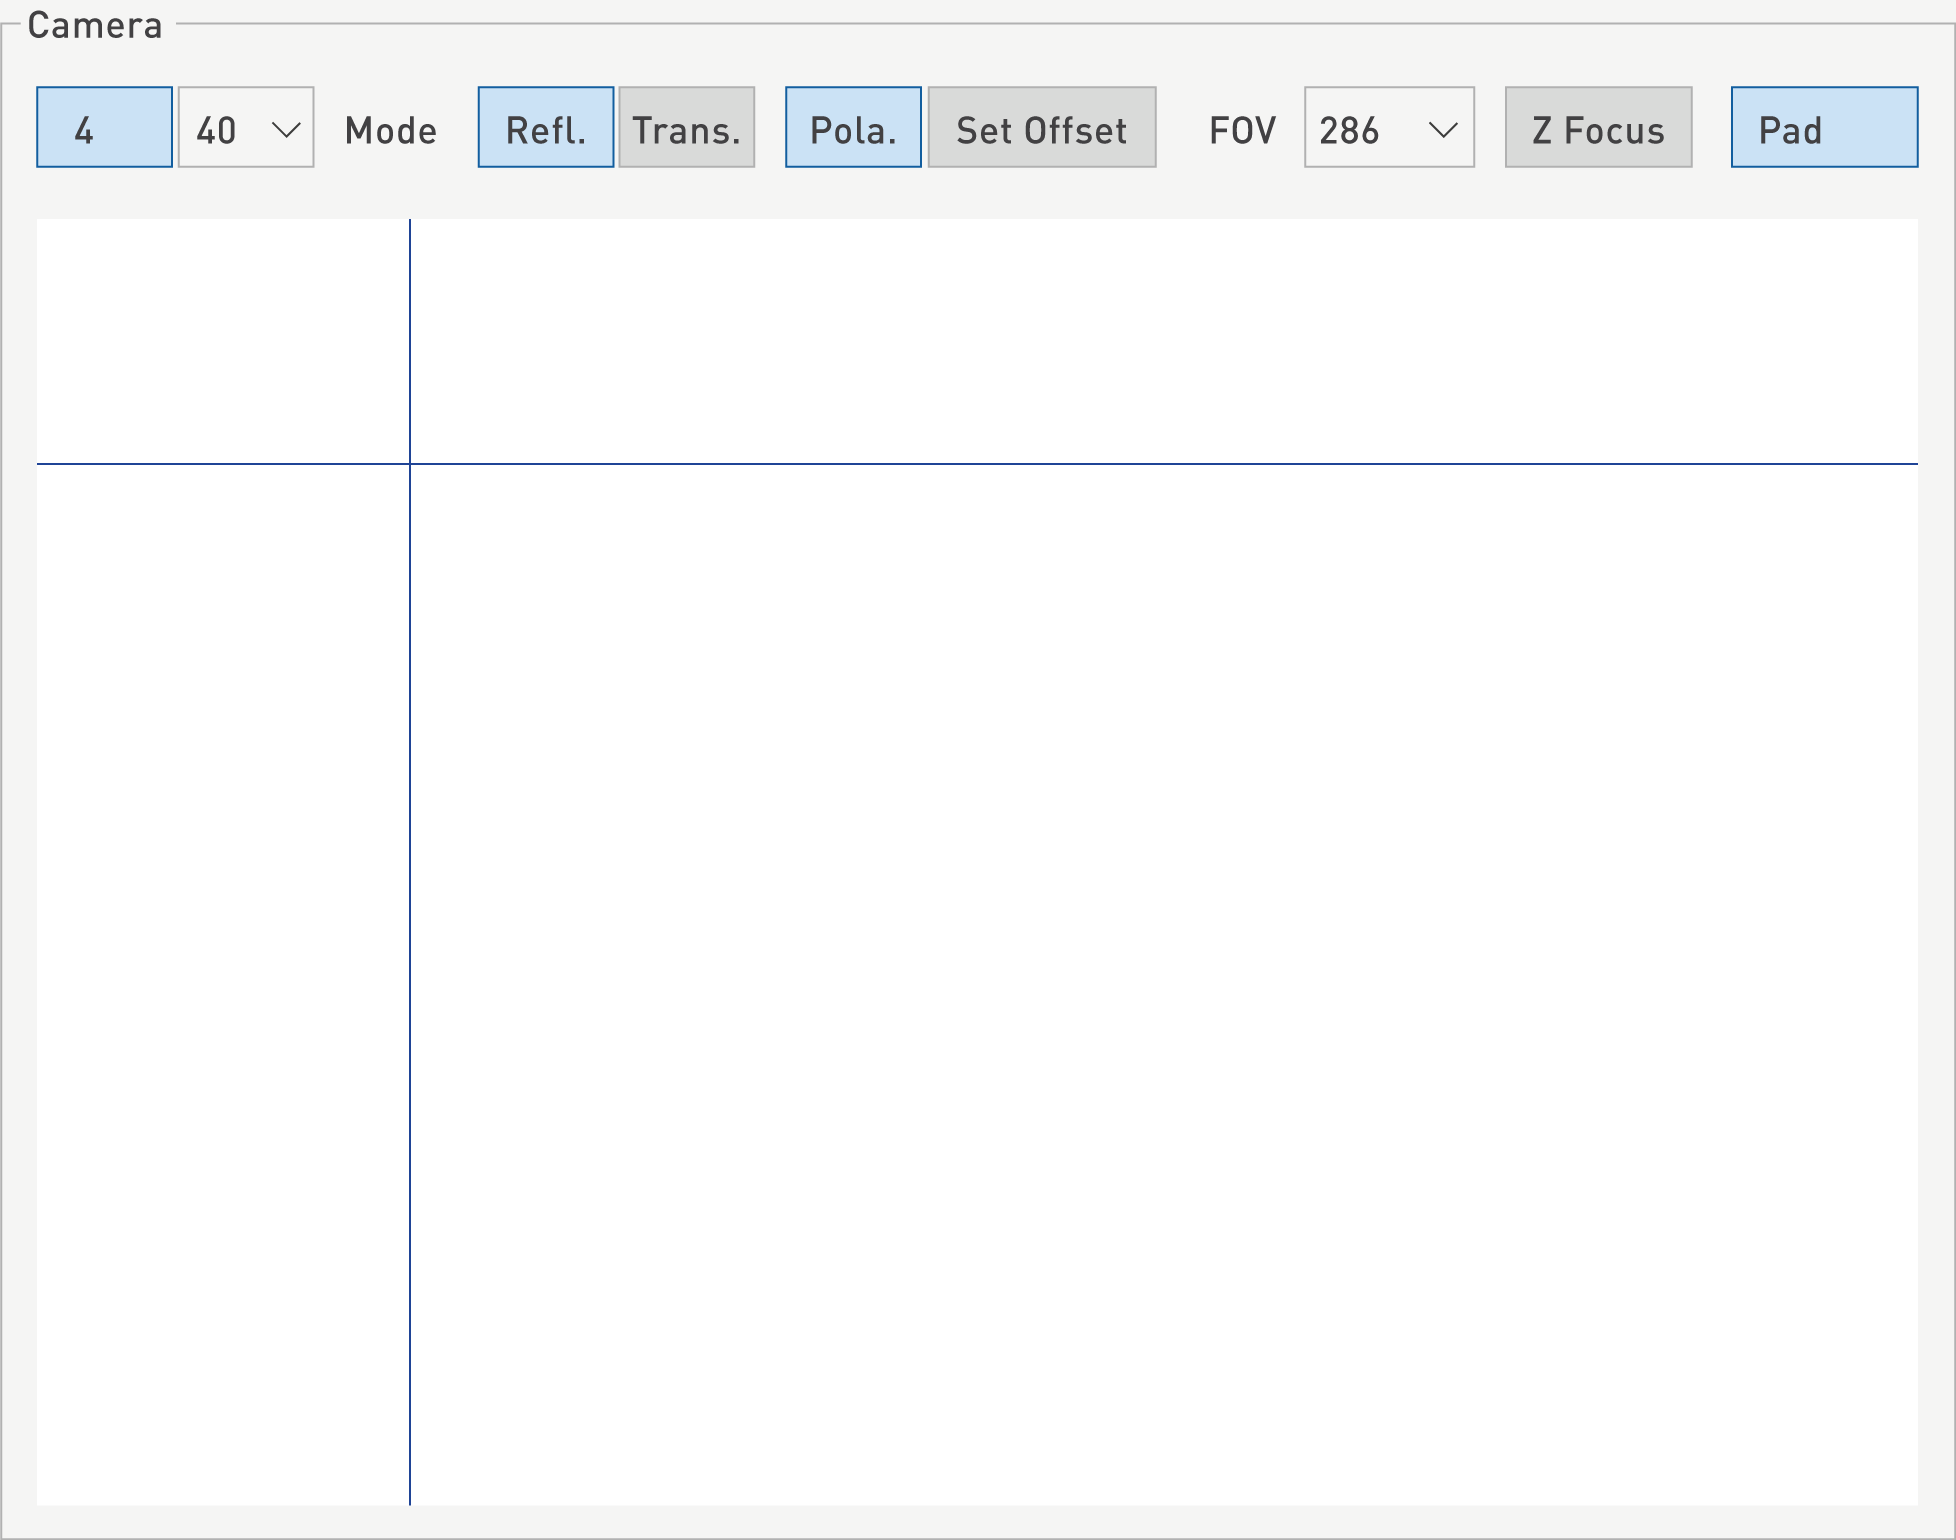
Since upper and lower polarizers, above and below the sample, respectively, are essential parts of the Transmitted Light optical setup, their tuning is required to get the best image. When the polarizers are properly crossed, they will induce extinction of the transmitted light. An offset can then be adjusted so that the polarizers are correctly oriented.
The ‘Set Offset’ function refers to an angular offset (rotating discs) correcting the offset aimed at positioning the polarizers at 90 degrees from each other.
Note that on Skaphia (shielded version), there is no transmitted and polarized light.
Pad
‘Pad’ is a function for SX100 SxFive which, when activated, allows sample motion by clicking on any visible detail on the picture displayed on the RTM. Clicking on Pad will replace the optical camera picture by an active area which simulates the RTM monitor. The cursor of the RTM is synchronized with the mouse motion. If a double click is applied at a specific detail, the stage will be moved to place that detail in the center of the SEM picture. One can then click on ‘Camera’ to come back to the Camera view.
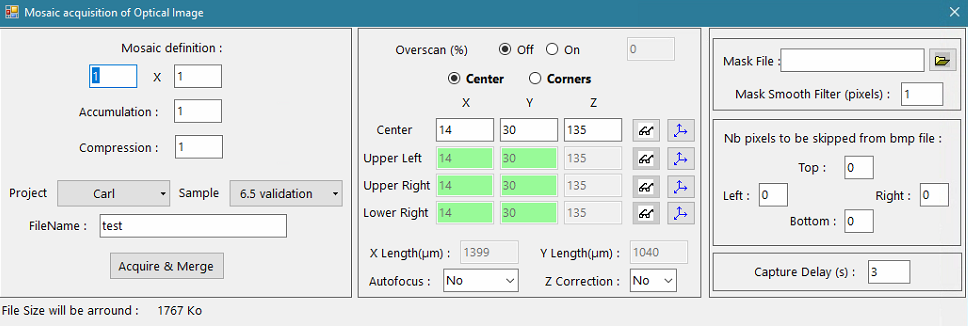
Mosaic
‘The User can acquire a mosaic.
By clicking on the Mosaic button, a pop-up window opens where the user can define the number of cells, the accumulation desired and the compression. The resulting file can be directly saved into a specific Project and a related Sample.
An overscan (in %) can be selected and the positions can de defined using the center of the image of the corners. A mask can be applied and some pixels can be automatically removed from the bmp file. A capture delay (in seconds) can also be applied
Pressing (CTRL + left click) starts the stage motion, which is maintained by keeping the left click activated but with the CTRL key released. The stage speed is proportional to the distance between the mouse cursor and the center of the image. The larger this distance, the faster the stage motion is. The vector direction between the center of the image and the cursor defines the motion direction. The Red Crosshair on the screen corresponds to the cursor position.
Magnification
The Field of View (FOV) of an image can be changed by selecting the drop-down menu allowing a range from 250 µm up to 1750 µm. These values are a direct measurement of the image width on the screen.
The lowest magnification corresponds to the value of 1750 µm as it gives the largest FOV, and conversely, the value of 250 µm will provide the highest magnification on the screen. It is usually recommended to use a default value of 500 for the FOV to have sufficient sensitivity to focus the beam.
Focus
Focus can be manually set using the dedicated physical thumbwheel on the Control Keyboard. Otherwise, the ‘Z focus’ button enables an automatic optical focus of the sample in order to get the sample at the proper working distance. This ensures that the WDS is properly set on the Roland circle for the best X-ray detection.
SEM
In the SEM sub-panel, the user has access to different useful parameters.
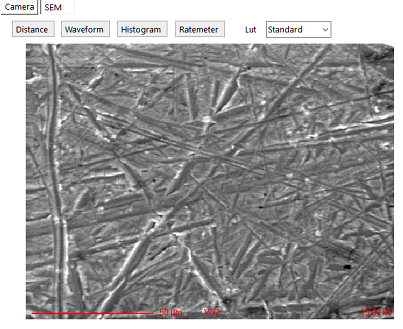
Distance
By selecting ‘Distance’, the user can draw a line on the SEM image and have the information about the distance in um.
Waveform
By selecting ‘Waveform’ the user can have information about saturation of the different signals. It is a useful tool to set-up the brightness/contrast parameters of the SE or BSE images.
Histogram
By selecting ‘histogram’ the user can have access to the representation of the distribution of the different signals.
Ratemeter
Ratemeter enables to display the X-ray signals coming from the different spectrometers on the SEM image. It is useful to quickly know if an element is present or not or if there is a saturation of the counter.
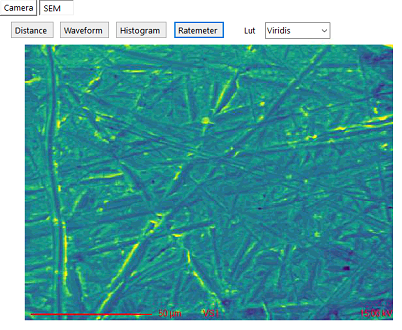
LUT
The user can change the colors of the SEM image.
Related Article
SX-Control – SEM
Reading Duration 10min
Once the beam setup parameters are properly defined and the vacuum levels are good enough to start an analysis, aspects related to the Scanning Electron Microscope as well as the Wavelength Dispersive Spectrometers (WDS) panel need to be considered. In this section, users will have control of the parameters inherent to the video signals coming through the Video Channels and displayed on the RTM.
SX-Control – SEM More
Reading Duration 6min
A few advanced settings are available for a more in-depth treatment of the images acquired during an EPMA experiment. These settings are accessible under the SEM More menu.
SX-Control – WDS panel
Reading Duration 2min
The fourth menu of the SX Control module controls the spectrometry part of the instrument (definition of the WDS parameters).
SX-Control – WDS & Spectro
Reading Duration 45min
This section gathers all the functions and information dedicated to the Wavelenght Dispersive Spectroscopy (WDS) settings and analysis parameters.
Contact

Our support team is ready to help you
FAQ

Answers to some common questions from SX users
Troubleshooting

Quickly search for solutions to instrument issues