SX-Control – SEM
Overview
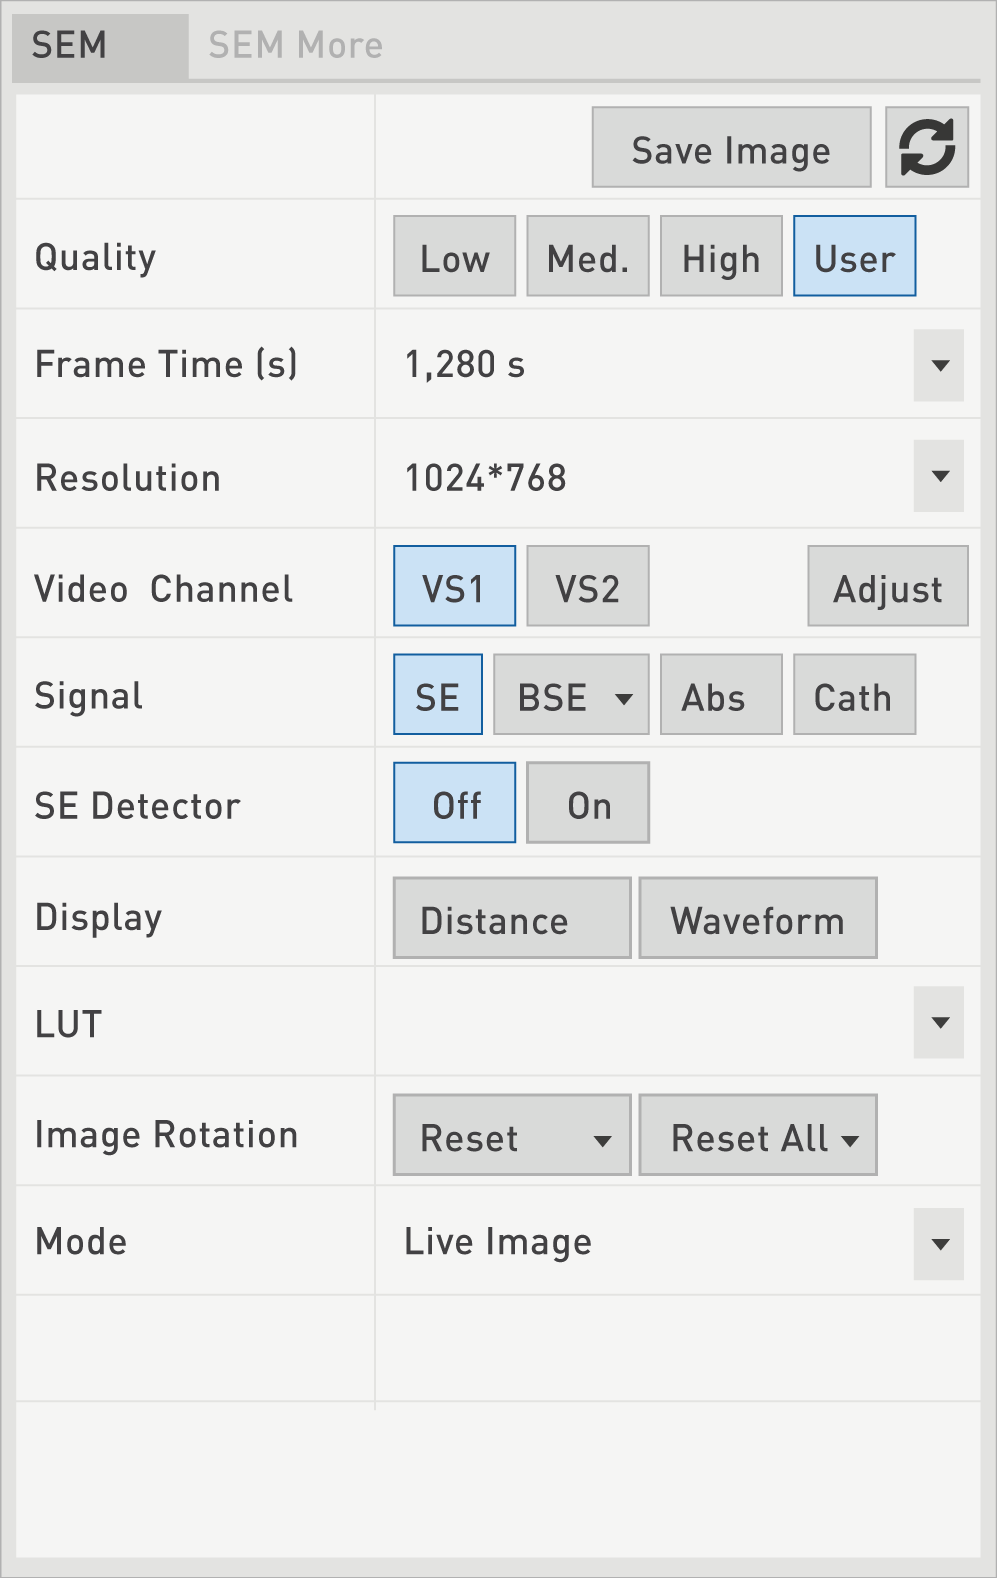
Once the beam setup parameters are properly defined and the vacuum levels are good enough to start an analysis, aspects related to the Scanning Electron Microscope as well as the Wavelength Dispersive Spectrometers (WDS) panel need to be considered. In this section, users will have control of the parameters inherent to the video signals coming through the Video Channels and displayed on the RTM.
Some of the noteworthy parameters of the SEM panel pertain to imaging quality, resolution, timing, as well as the collected and resulting signals. Acquisition, display, and video are the three interdependent aspects of the analysis when using the SEM part of an EPMA.
Acquisitions
Therefore, a user can choose to acquire 1, 4 or 12 images. ‘Acq. Selection’ option allows the user to choose vidéo signal and digital view to display or not on the acquisition. ‘Save & Display’ function acquire the current image and display it in the SX-Result program.
Quality
The overall image quality will depend on the image resolution and the image acquisition time, which can be independently adjusted by selecting the User icon. When Low, Medium or High Quality modes are selected, preset values are already in place for Resolution and Frame Time.
Frame Time
With the User mode selected, the scanning speed can be adjusted by choosing the scanning time per single frame, knowing that the possible frame times available through the drop-down menu depend upon the number of acquired images and the selected resolutions. Generally, the higher the frame time, the better the image detail level is.
Resolution
When the User mode is selected, the image resolution gets defined by the number of pixels per line and the number of lines. As the available resolution through the drop-down menu depends upon the number of acquired images, it is recommended to select first the number of images on the Acquisitions function.
Acq. Selection
Allow the selection of the desired video flux
VS1 and VS2 are independant video channels that can be set separately to display secondary electron (SE) and backscaterred electron (BSE) images
An automatic routine tunes the selected SEM signals (in particular brightness and contrast) after the ‘Adjust’ button has been activated.
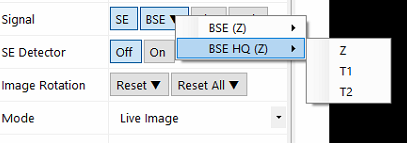
Signal
Once a Video channel has been assigned to display a Signal on the SEM RTM, users can monitor Secondary Electrons (SE), Absorbed Current (Abs), Backscattered Electrons (BSE) or Auxiliary (for example, Cathodo-Luminescence, Cat) signals.
SE created under the primary electron bombardment are collected and accelerated, into a scintillator, which converts the electrons into photons. These photons are then passed through a light guide into a Photo-Multiplier (PM). The scintillator and the light guide are under vacuum while the PM resides outside the chamber.
The SE signal shape is composed of AC and DC components. The DC component contributes to the brightness of the image while the AC influences the image contrast and is representative of the sample roughness. Since SE are emitted at very low energy, their intensity is very sensitive to the roughness of the specimen. Therefore, the information given by a SE image is mainly topographical.
The BSE detector is composed of six semiconductor diodes positioned directly above the sample surface, where each individual diode has a surface area of 30 mm and corresponds to a port where the WDS spectrometers or the EDS spectrometer are fitted. Each BSE diode can be selected individually for line-of-sight view and is connected to an individual amplifier. When the signals from all 6 diodes are summed together, one obtains atomic contrast images (BSE Z).
Then the signals from the six diodes are subtracted, one obtains Topographic contrast images (BSE T).
Analogous to the SE signal, the BSE signal contains both AC and DC components. The DC part contributes to the brightness of the image as it did for the SE, but the AC part that contributes to the image contrast is representative of the atomic variation, not the sample roughness.
As a quick reminder, backscattered electrons are emitted by the sample under the primary beam bombardment and correspond to primary electrons that have lost energy after interaction with the specimen. Their intensity depends not only on the primary beam intensity but also of the mean atomic number (Z) of the specimen. The higher the mean atomic number, the larger the BSE coefficient, and correspondingly, the smaller the Z, the lower the BSE coefficient. In short, bright areas on a BSE image correspond to a heavy matrix (high Z number) while dark areas correspond to a lighter matrix (lower Z number).
By selecting BSE 1, BSE 2, BSE 3, BSE 4, or BSE 5 in the Signal drop-down menu shown above, one can perform Line-of-Sight images. The BSE # option corresponds to the various ports of the WDS spectrometers. The images acquired and displayed correspond exactly to the sample geometry as seen by each spectrometer. Such a configuration is essential to easily distinguish artifacts due to shadowing effects versus artifacts due to sample roughness.
Using SX5-Tactis, an additional and retractable Back-Scattered Electron detection system for enhanced imaging especially at low keV (BSE HQ, stands for High Quality) with 4 diodes.
The displacement of the BSE HQ detector is fully automatic and managed by the software when doing X-ray acquisitions but the user can also manually move in/out and perform the contrast/intensity settings.
As for you standard BSE detector it’s possible to subtract the signal from the diodes and obtain Topographic contrast images (BSE T1 and T2).
Display
The Ratemeter button can be toggled ON and OFF in order to provide metrics (intensity) during real-time image acquisition.
Similarly to the Ratemeter option, the Waveform function is only useful for the imaging part of the experiment. This function overlays a horizontal line scan on the real-time image, and the metric is reflected in terms of the signal variation or deviation from the initial horizontal line.
LUT is linked to a color scale for the images displayed on the RTM. The available range of colors is readily accessible with a left click on the LUT icon, and it should help denote some features otherwise difficult to discern on a pure black and white image.
Mode
Another image processing technique consists in averaging a number of captured images to improve the Signal-to-Noise ratio and extract a higher quality image compared to a single captured frame. This is very useful when noisy images result from low beam intensities. Users also have the option of using an Average Time, in which case the program calculates the number of frames required to obtain the requested averaging time. In case the Live Image option is favored, the image displayed on the RTM will remain unprocessed.
Related Article
SX-Control – Beam
Reading Duration 18min
The second panel of the SX-Control module is dedicated to the beam conditions.
SX-Control – Source
Reading Duration 1min
This tab is only dedicated to the SX system including the Field Emission Gun (FEG).
SX-Control – SEM More
Reading Duration 6min
A few advanced settings are available for a more in-depth treatment of the images acquired during an EPMA experiment. These settings are accessible under the SEM More menu.
SX-Control – Camera-SEM
Reading Duration 8min
The upper right panel of the SX-Control module is the Camera panel and controls parameters linked to the optical light microscope. This latter can be operated using transmitted or reflected light, in normal or polarized mode, and at various magnifications and Z focus settings.
Contact

Our support team is ready to help you
FAQ

Answers to some common questions from SX users
Troubleshooting

Quickly search for solutions to instrument issues