SX-Control – Fast Acquisition
Overview
The Fast Acquisition frame (WDS #3) quickly gathers some measurements with the already-optimized preset values for the parameters discussed in the previous section. The four main functionalities that will be described in this Fast Acquisition frame are WDS Spectrum, Profiles, Images, and Quanti.
WDS Spectrum
The ‘WDS Spectrum’ function records a spectrum scan at the current stage position and column conditions. After the spectrometers and associated crystals are selected in the WDS #2 table, the user is given access to the number of Steps and Dwell time (DTime) for the scan. Typically, these values are on the order of 1500 to 2000 for the Steps and 100 ms for the DTime. Althrough preset values are defined in drop down menus, users can type in their own custom values. The Time value indicated between the Steps and the DTime options will be greyed out since this value is directly calculated by the software for a single scan based on the two others input values as well as other counting time routines (Peak and Background for instance).
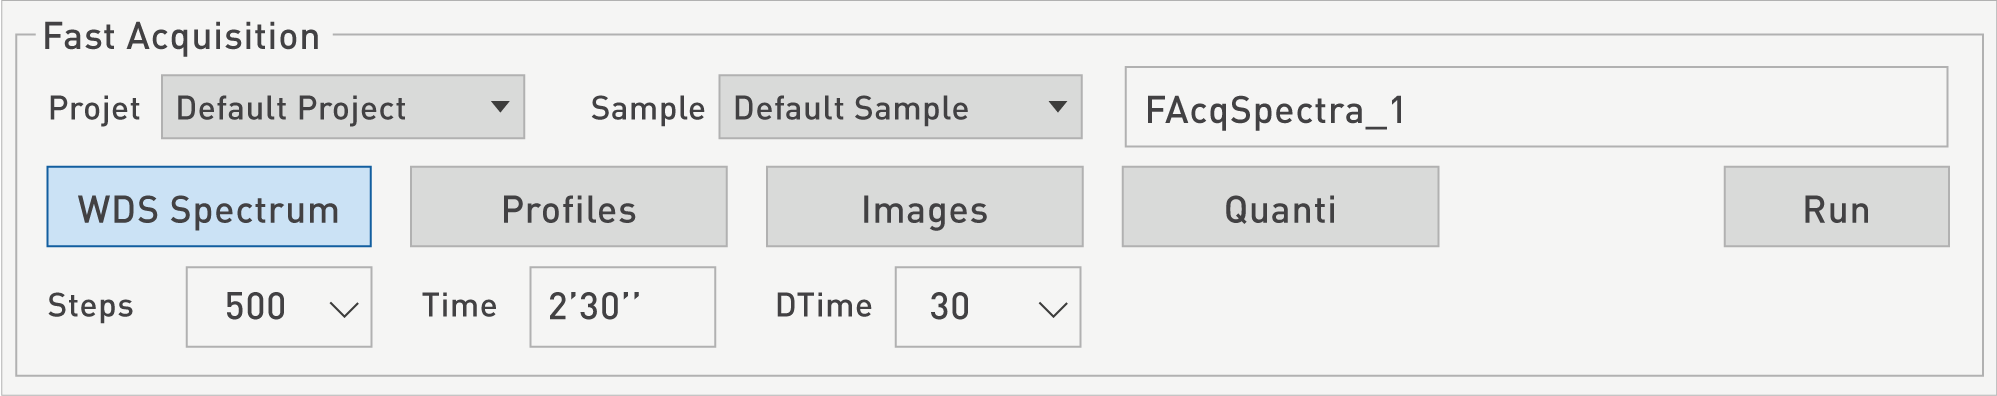
The WDS spectrum will be acquired on the full spectral range of the selected spectrometer (from Sin θ min to Sin θ max) by clicking on the ‘Run’ button. Once an acquisition has started, the Run button turns into ‘Abort’ and a choice is given to Abort Immediately, or to Abort at End of Pass enabling the scan to probe the full spectral range.
During the acquisition, the spectrum will be displayed in the SX-SAB program and will be stored under a filename given by the program: FAcqSpectra_1.wdsDat in the current Project name / Sample Name / WDS Spectra folder.
Profiles
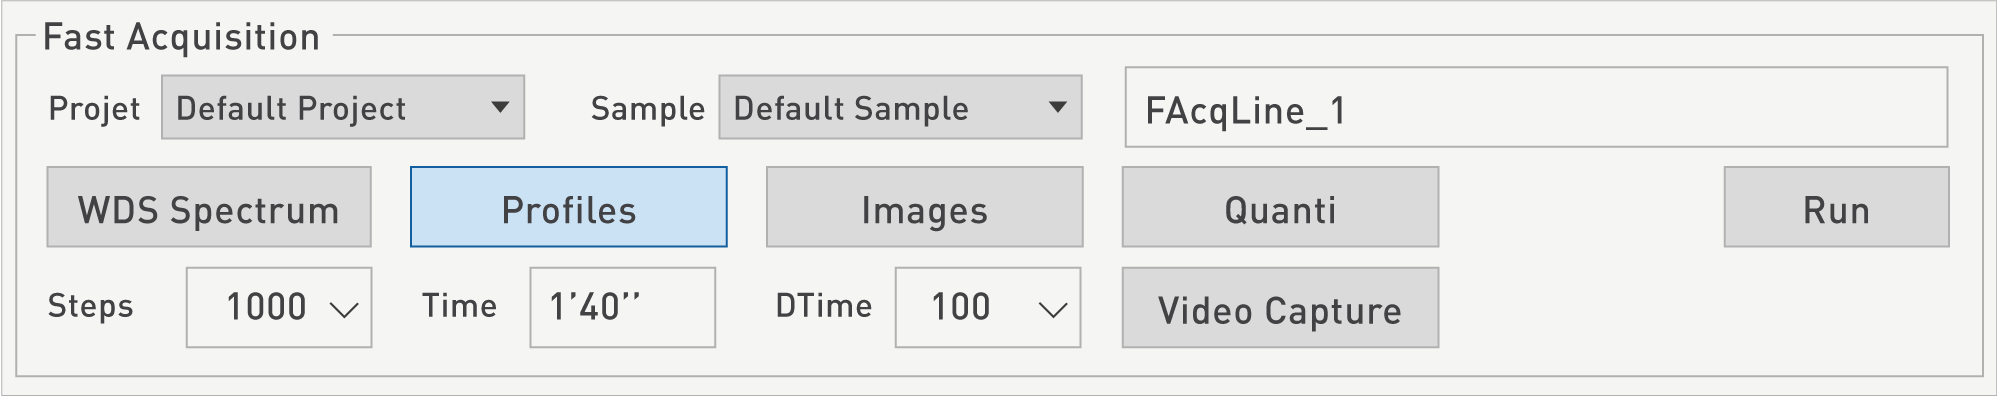
The Profiles function acquires X-ray line intensities on a line profile at the current stage position and column conditions. Similar to the WDS Spectrum sequence, after the spectrometers and associated crystals are selected in the WDS #2 table, the user is given access to the number of Steps and Dwell time (DTime) for the profile acquisition. Typically, these values are on the order of 100 for the Steps and 100 ms for the DTime. The line profile is a horizontal line located at the current stage coordinates and the length of the profile is defined by the raster length of the electronic image. The software will calculate the time needed to acquire a single scan.
If the raster length is smaller than 50 µm, the acquisition will be done in a beam scanning mode while for a raster length larger than 50 µm, the acquisition will be done in the stage scanning mode. Note that aside from the selection of the spectrometer numbers, crystal types, Steps, and DTime values, the SE or BSE picture will have to be adjusted in the SX Control SEM panel in order to obtain an image of reasonably good contrast and quality.
If the ‘Video Capture’ function is selected, the current video picture will be transferred to the SX-Results program and the line scans will be overlaid on the Video captured image.
The Line Scan Profile is started by a left click on the ‘Run’ button. Once an acquisition has started, the Run button turns into ‘Abort’ and a choice is given to Abort Immediately, or to Abort at End of Pass enabling the line scan to reach its full length.
During the acquisition, the line scans will be displayed in the SX-SAB program and will be stored under a filename given by the program: FAcqLine_1.impDat in the current Project name / Sample Name / Images & Profile folder.
At the end of the acquisition, line scans are displayed in SX-Results as two distinct datasets. The first dataset will only display the line scans, while the second dataset will overlay them on the Video captured image, as shown below.
![]()
Images
The ‘Images’ function acquires X-ray images at the current stage position and column conditions.
Similarly to the Profiles sequence, after the spectrometers and associated crystals are selected in the WDS #2 table, the users are given access to the number of Steps and Dwell time (DTime) for the profile acquisition. Typically, these values are on the order of 256 for the Steps and 5ms the DTime. The acquired image is located at the current stage coordinates and image size is defined by the raster length of the electronic image. The software will calculate the time needed to acquire a single scan.

If the raster length is smaller than 50 µm, the acquisition will be done in a beam scanning mode while for a raster length larger than 50 µm, the acquisition will be done in the stage scanning mode, as previously stated. Note that aside from the selection of the spectrometer numbers, crystal types, Steps, and DTime values, the SE or BSE picture will have to be adjusted in the SX Control SEM panel in order to obtain an image of reasonably good quality.
The X-ray image acquisition will start by clicking on the ‘Run’ button. Once an acquisition has started, the Run button turns into ‘Abort’ and a choice is given to Abort Immediately, or to Abort at End of Pass enabling the image to be recorded on the defined field of view.
During the acquisition, the images will be displayed in the SX-SAB program and will be stored under a filename given by the program: FAcqImage_1.impDat in the current Project name / Sample Name / Images & Profile folder.
Quantification
This function of the Fast Acquisition frame allows a quantitative analysis to be recorded at the current stage position and column conditions. It is accessible by clicking on ‘Quanti’.
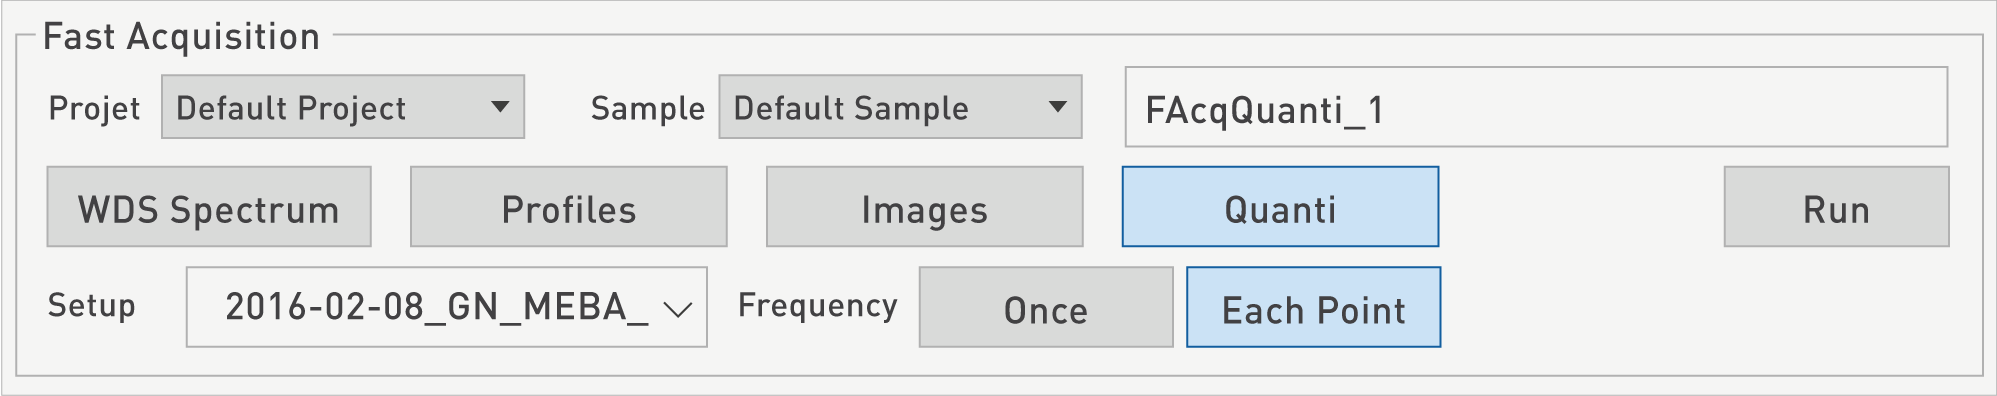
First, quantification recipe from the list displayed in the Setup drop down menu must be selected. This list comes from the various recipes created and stored in the SX Settings program (The Quanti settings are created in the SX-SAB program).
For the Frequency option, if ‘Once’ is selected, the program loads the Quanti setup at the first point and the current column conditions are then applied for all following points of the acquisition dataset. This feature accepts changes in the experimental conditions from one point to the next.
If ‘Each Point’ is selected, the program loads the Quanti setup for each point.
The acquisition will start by clicking on the ‘Run’ button. Once an acquisition has started, the Run button turns into ‘Abort’ and a choice is given to Abort Immediately, or to Abort at End Of Pass enabling the current cycle to be recorded.
The recorded acquisition will be displayed in the SX Results program and will be stored under a filename given by the program: FAcqQuanti_1.qtiDat in the current Project name / Sample Name / Quanti folder.
Starting an acquisition in the ‘Quanti’ menu will automatically open up the Sx-SAB window. This is equivalent to opening the Setting/Acquisition menu in the SX-Control Analysis. The Sx-SAB menu is described in the SX-Analysis section.
Related Article
SX-Control – WDS panel
Reading Duration 2min
The fourth menu of the SX Control module controls the spectrometry part of the instrument (definition of the WDS parameters).
SX-Control – WDS & Spectro
Reading Duration 45min
This section gathers all the functions and information dedicated to the Wavelenght Dispersive Spectroscopy (WDS) settings and analysis parameters.
SX-Control – Multipurpose
Reading Duration 28min
The last panel available in the SX Control menu is the last one, and has been partially covered in the other sections of the SX Control. This panel serves multiple purposes for the user.
Contact

Our support team is ready to help you
FAQ

Answers to some common questions from SX users
Troubleshooting

Quickly search for solutions to instrument issues