Contact

Our support team is ready to help you
FAQ

Answers to some common questions from SX users
Troubleshooting

Quickly search for solutions to instrument issues
Scanning Electron Microscopy
Scanning electron images are accessible though the Scanning Electron Microscopy (SEM) tab of the ETU software.
Three electron detectors are available (FIGURE):
1. SE - Secondary Electron: displays an image related to the surface topography of the sample.
2. BSE - BackScattered Electron: displays an image where brightness is proportional to the average atomic number, or chemical composition, of the sample.
3. BSE HQ – BackScattered Electron High Quality: same as BSE above, but with a more sensitive detector useful for operation at low beam voltages and/or low beam currents (< 7 keV or < 5 nA).
It can also be used at the same conditions as the standard BSE detector. The BSE HQ detector is a retractable detector. Insertion is automatic and takes a few seconds. The info box indicates BSE HQ status during the motion.
Each detector can be separately adjusted. Any modification will be applied only to the selected detector; previously-set parameters for non-selected detectors are retained. Detector selection occurs when the user presses the detector button and highlights it in blue.
Basic tuning
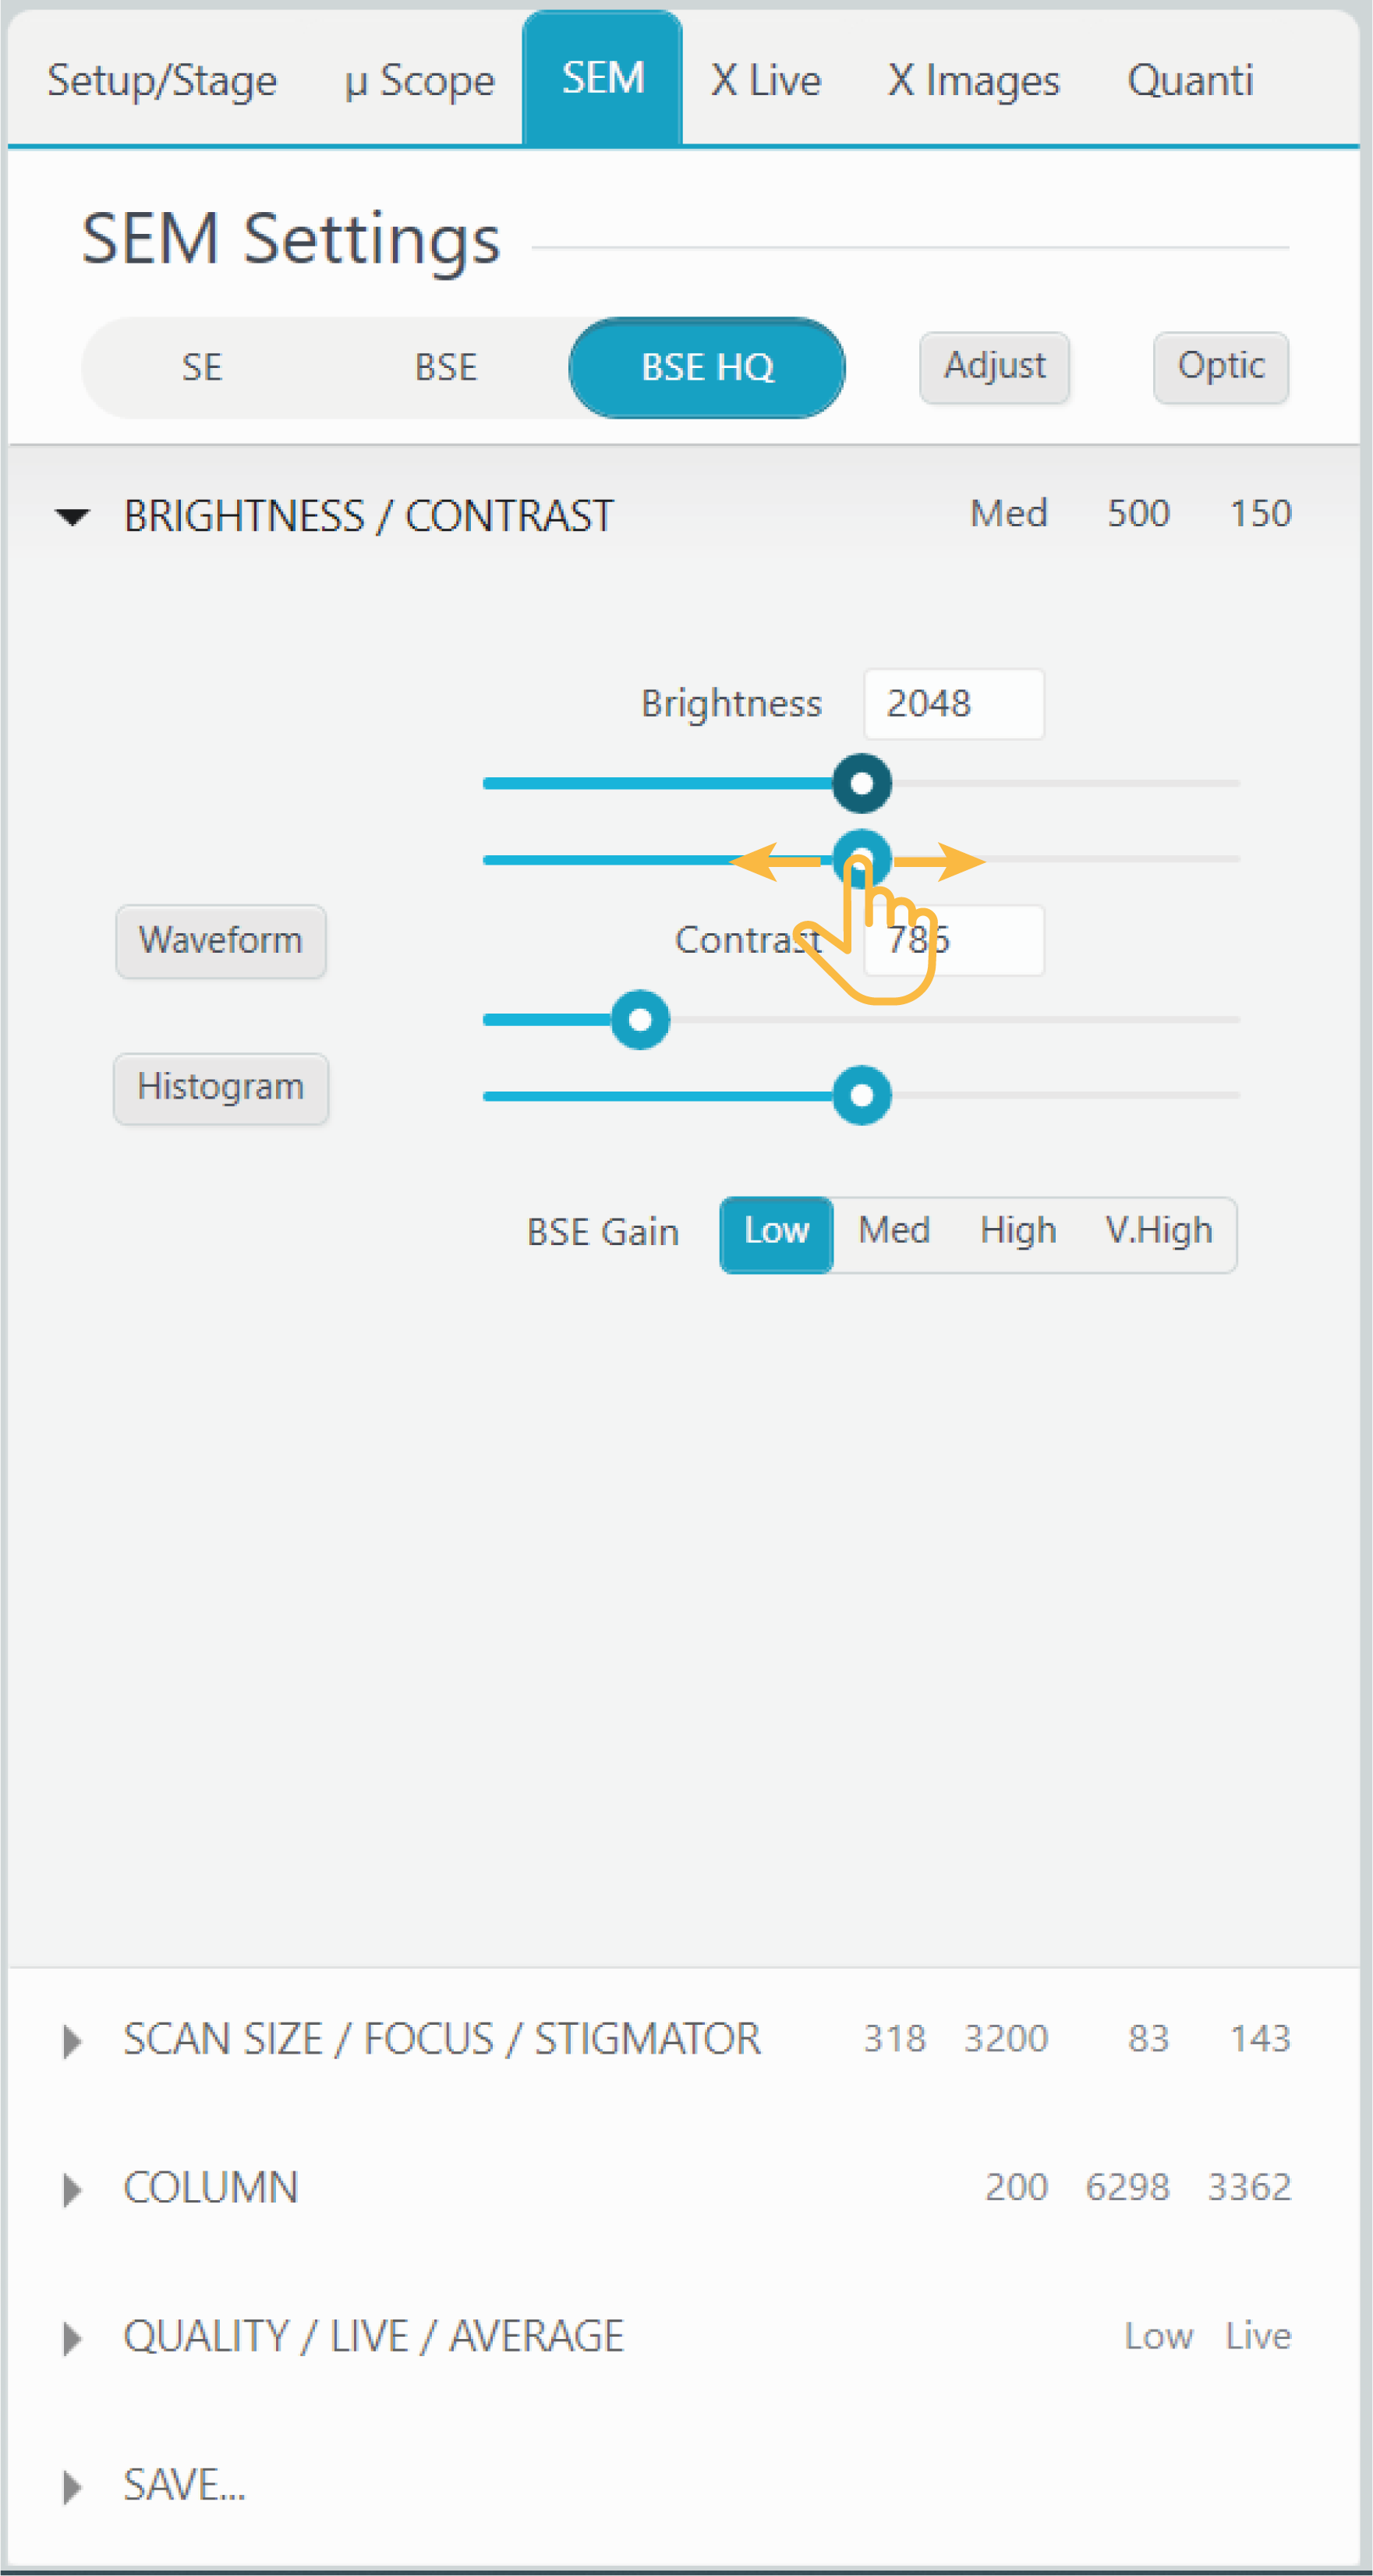
Brightness and contrast are the first parameters to check to improve image quality. In SX-ETU they can be adjusted though sliders (coarse at top and fine below for both brightness and contrast, see figure above).
The best black and white SEM image means that the darkest pixel of the picture is close to the black saturation and the lightest pixel is close to the white saturation. You can use the Waveform and Histogram as visual aids for setting brightness and contrast. Brightness will set the overall level (or offset), while contrast will set the range (or amplification) of the video signal.
The user can also adjust the BSE gain (only for BSE and BSE HQ). Increasing BSE gain will improve intensity but will also add noise to the picture.
There is no gain for the SE detector. Instead, there is a switch to turn on/off the SE detector (see figure below).
.
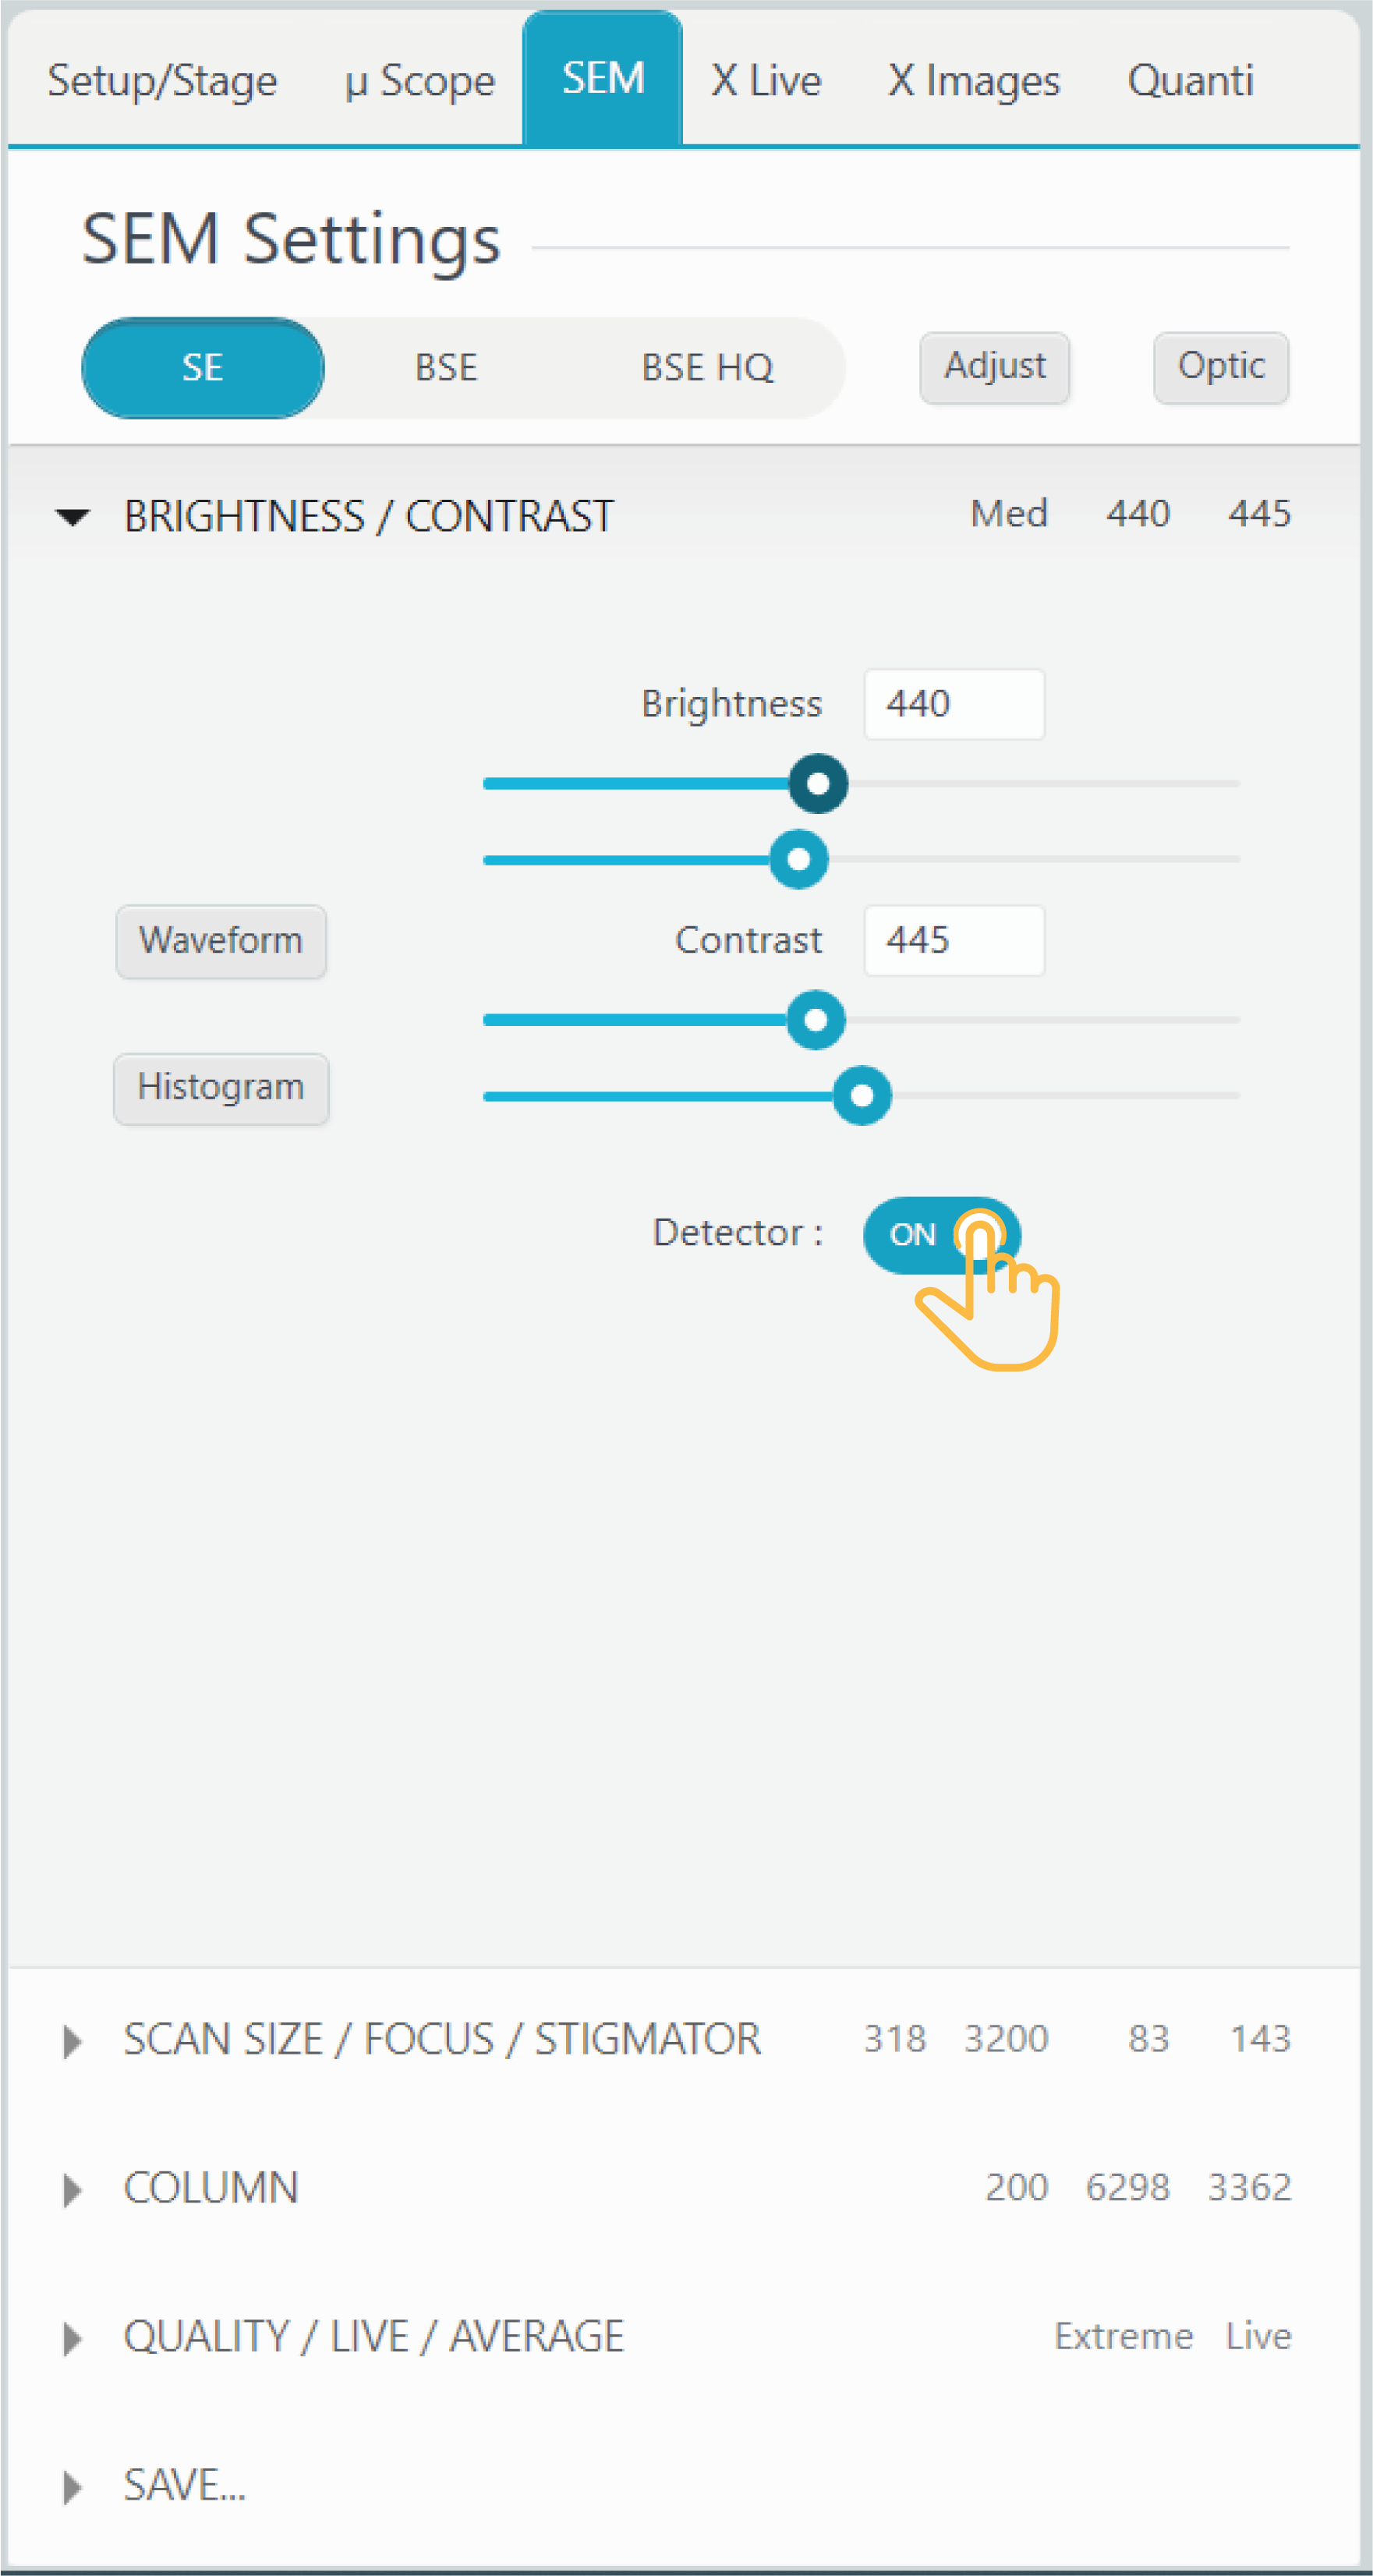
All these processes are iterative. User has to cycle the setting in to obtain best results. If a manual setting is not possible, user can touch the ‘Adjust’ button to automatically adjust contrast and brightness. This automatic process can be improved manually at its end.
Magnification, focus and astigmatism
Magnification or ‘SCAN SIZE’ can be set manually thought the touch screen wheel, corresponding slider below, or using the ‘Large’, ‘Med.’ and ‘Small’ preset. ‘SCAN SIZE’ is the width of the electron image in micrometers. Image scale bar is automatically adjusted according to the actual ‘SCAN SIZE’.
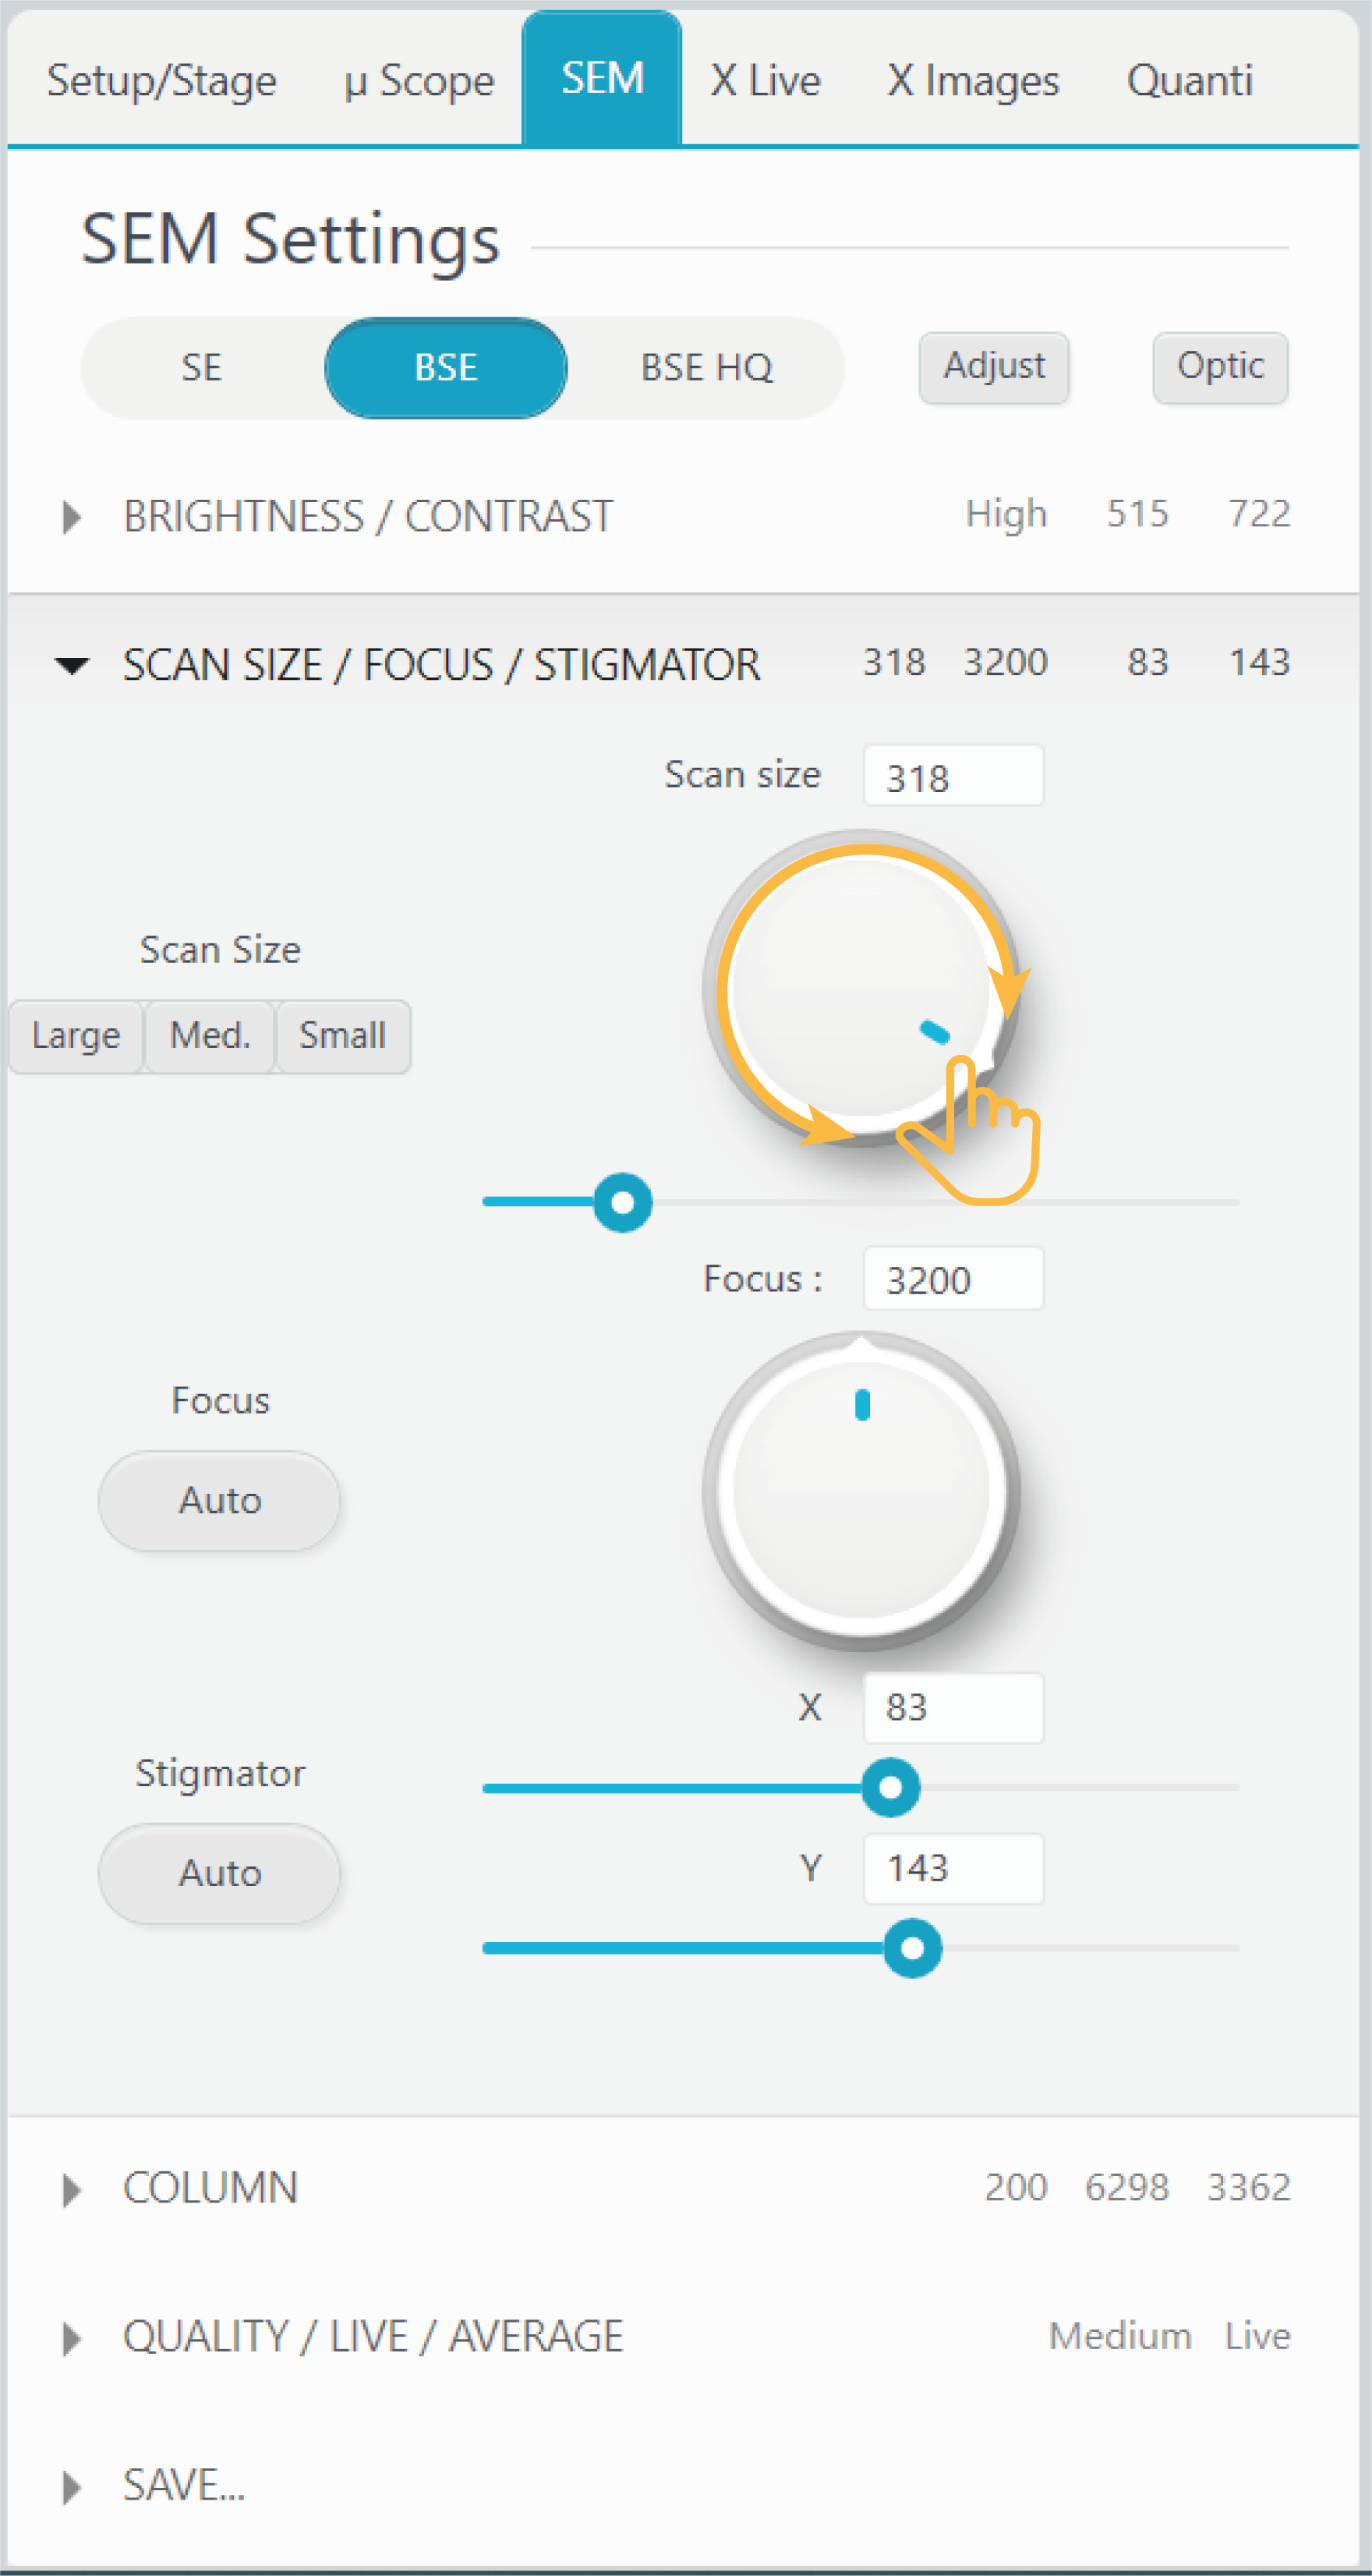
‘FOCUS’ is controlled by the dedicated wheel. The focus value is a unitless number representing the objective lens current. Focus should be obtained somewhere around 3200, when the sample is also in optical (Z) focus. Automatic focus can be activated though ‘Auto’ function. At higher magnifications, focus adjustment alone may not enough to obtain the sharpest image. In this case, astigmatism can provide improvements.
‘ASTIGMATISM’ can be tuned in X and Y using the respective sliders (alternatively, these controls may be Rotation and Magnitude, depending on instrument configuration). The process is iterative together with focus at high magnification. Automatic astigmatism setting can be achieved through the ‘Auto’ function.
Column
This subsection controls setting of the beam aperture and aperture centering.
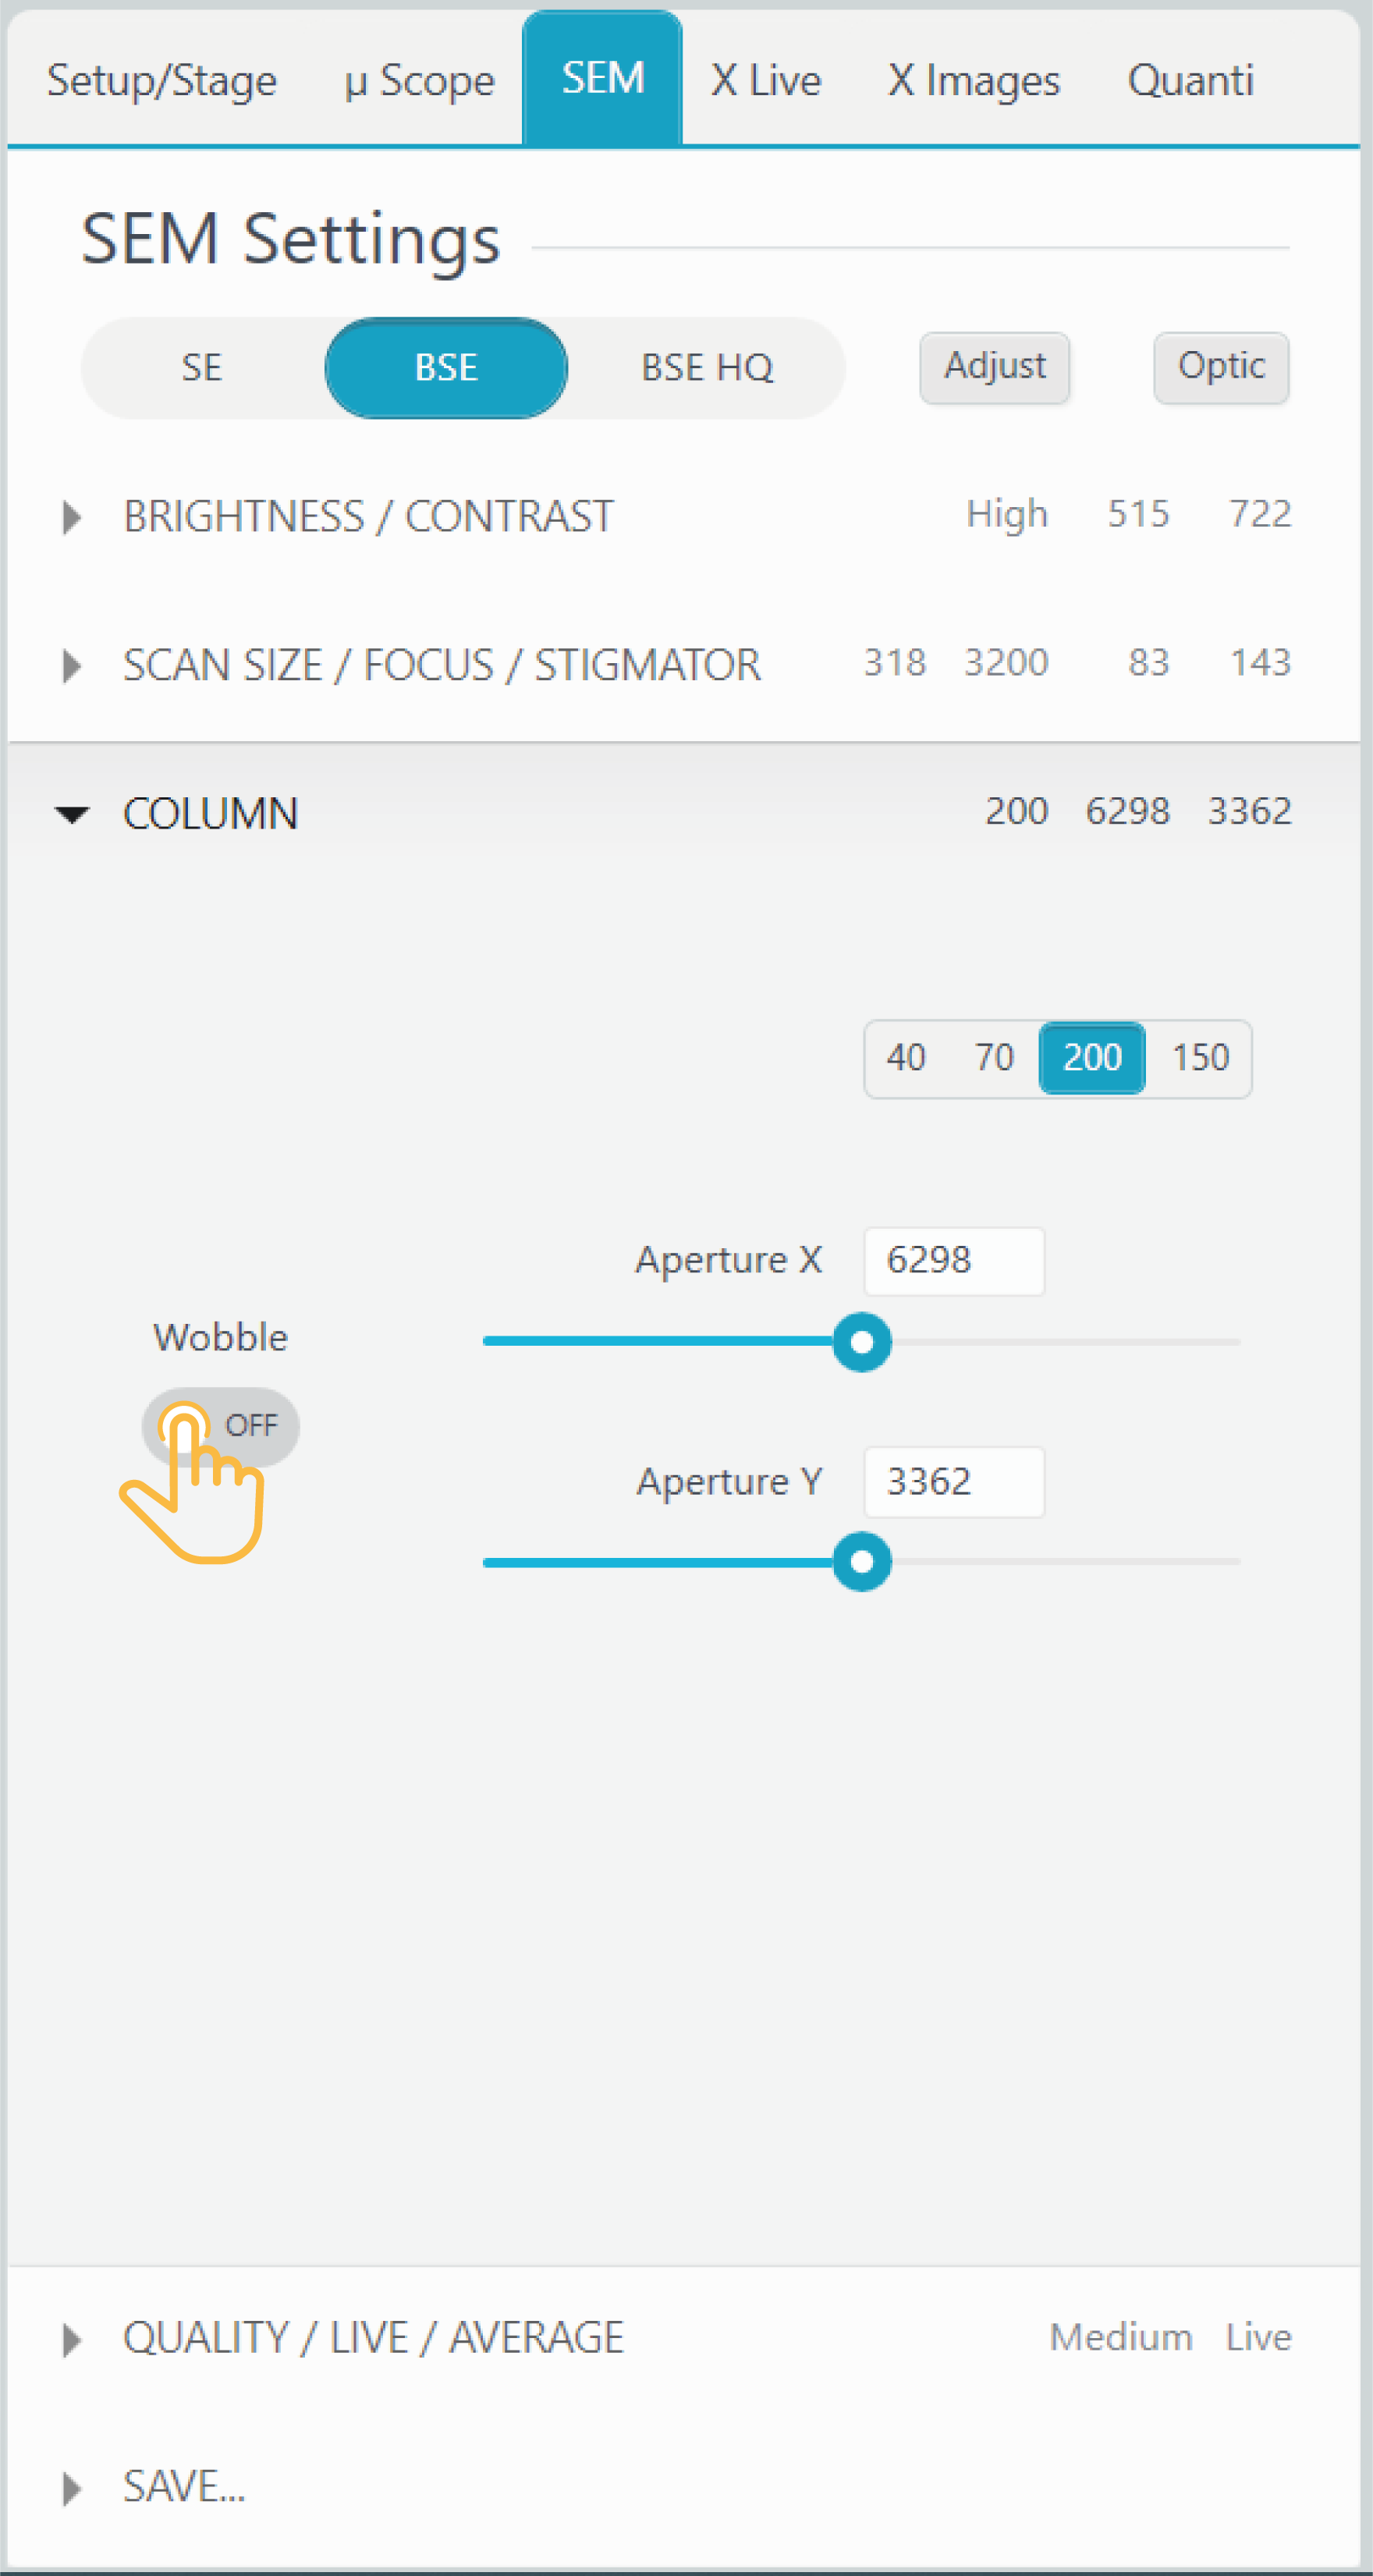
The aperture size determines the beam divergence angle as well as the maximum beam intensity value.
Suggested uses for each aperture are as follows:
| Aperture (μm) | Usage | Beam Current range | Notes |
| 40 |
Highest resolution SEM; very low beam current
|
pA to nA | The 40 µm aperture is often removed from the instrument, leaving a large “hole” as an aid in column alignment |
| 70 | High resolution SEM; low beam current | pA to nA | |
| 200 | General purpose analytical and imaging and high beam current (mapping, trace elements) | nA to µA | Maximum beam current depends on the source emission current |
| 150 | General purpose analytical and imaging | 3 nA to 299 nA | Double aperture assembly used for beam-regulation feedback |
Correct aperture centering will improve beam transmission and has a direct effect on the sharpness of the SEM image.
Centering the aperture is not easy under normal operating conditions, so we recommend activating the ‘Wobble’ function at moderate SEM magnification.
When activated, the focusing lens modulates around a centered focusing value.
Small features in the image should expand and contract concentrically. If they sweep from side to side, the final aperture needs to be tuned in X and Y directions with the goal of minimizing the image sweep.
Acquire and save images
Under the ‘QUALITY / LIVE / AVERAGE’ subsection user can choose a preset for image quality among ‘Low’, ‘Medium’, ‘High’ and ‘Extreme’.
‘Live / average’ options determine the number of scans combined to render one SEM image. Live image is based on one pass. If ‘8’, ’18’ or ’40’ are selected, the final image will be an average of 8, 18 or 40 images, respectively.
.
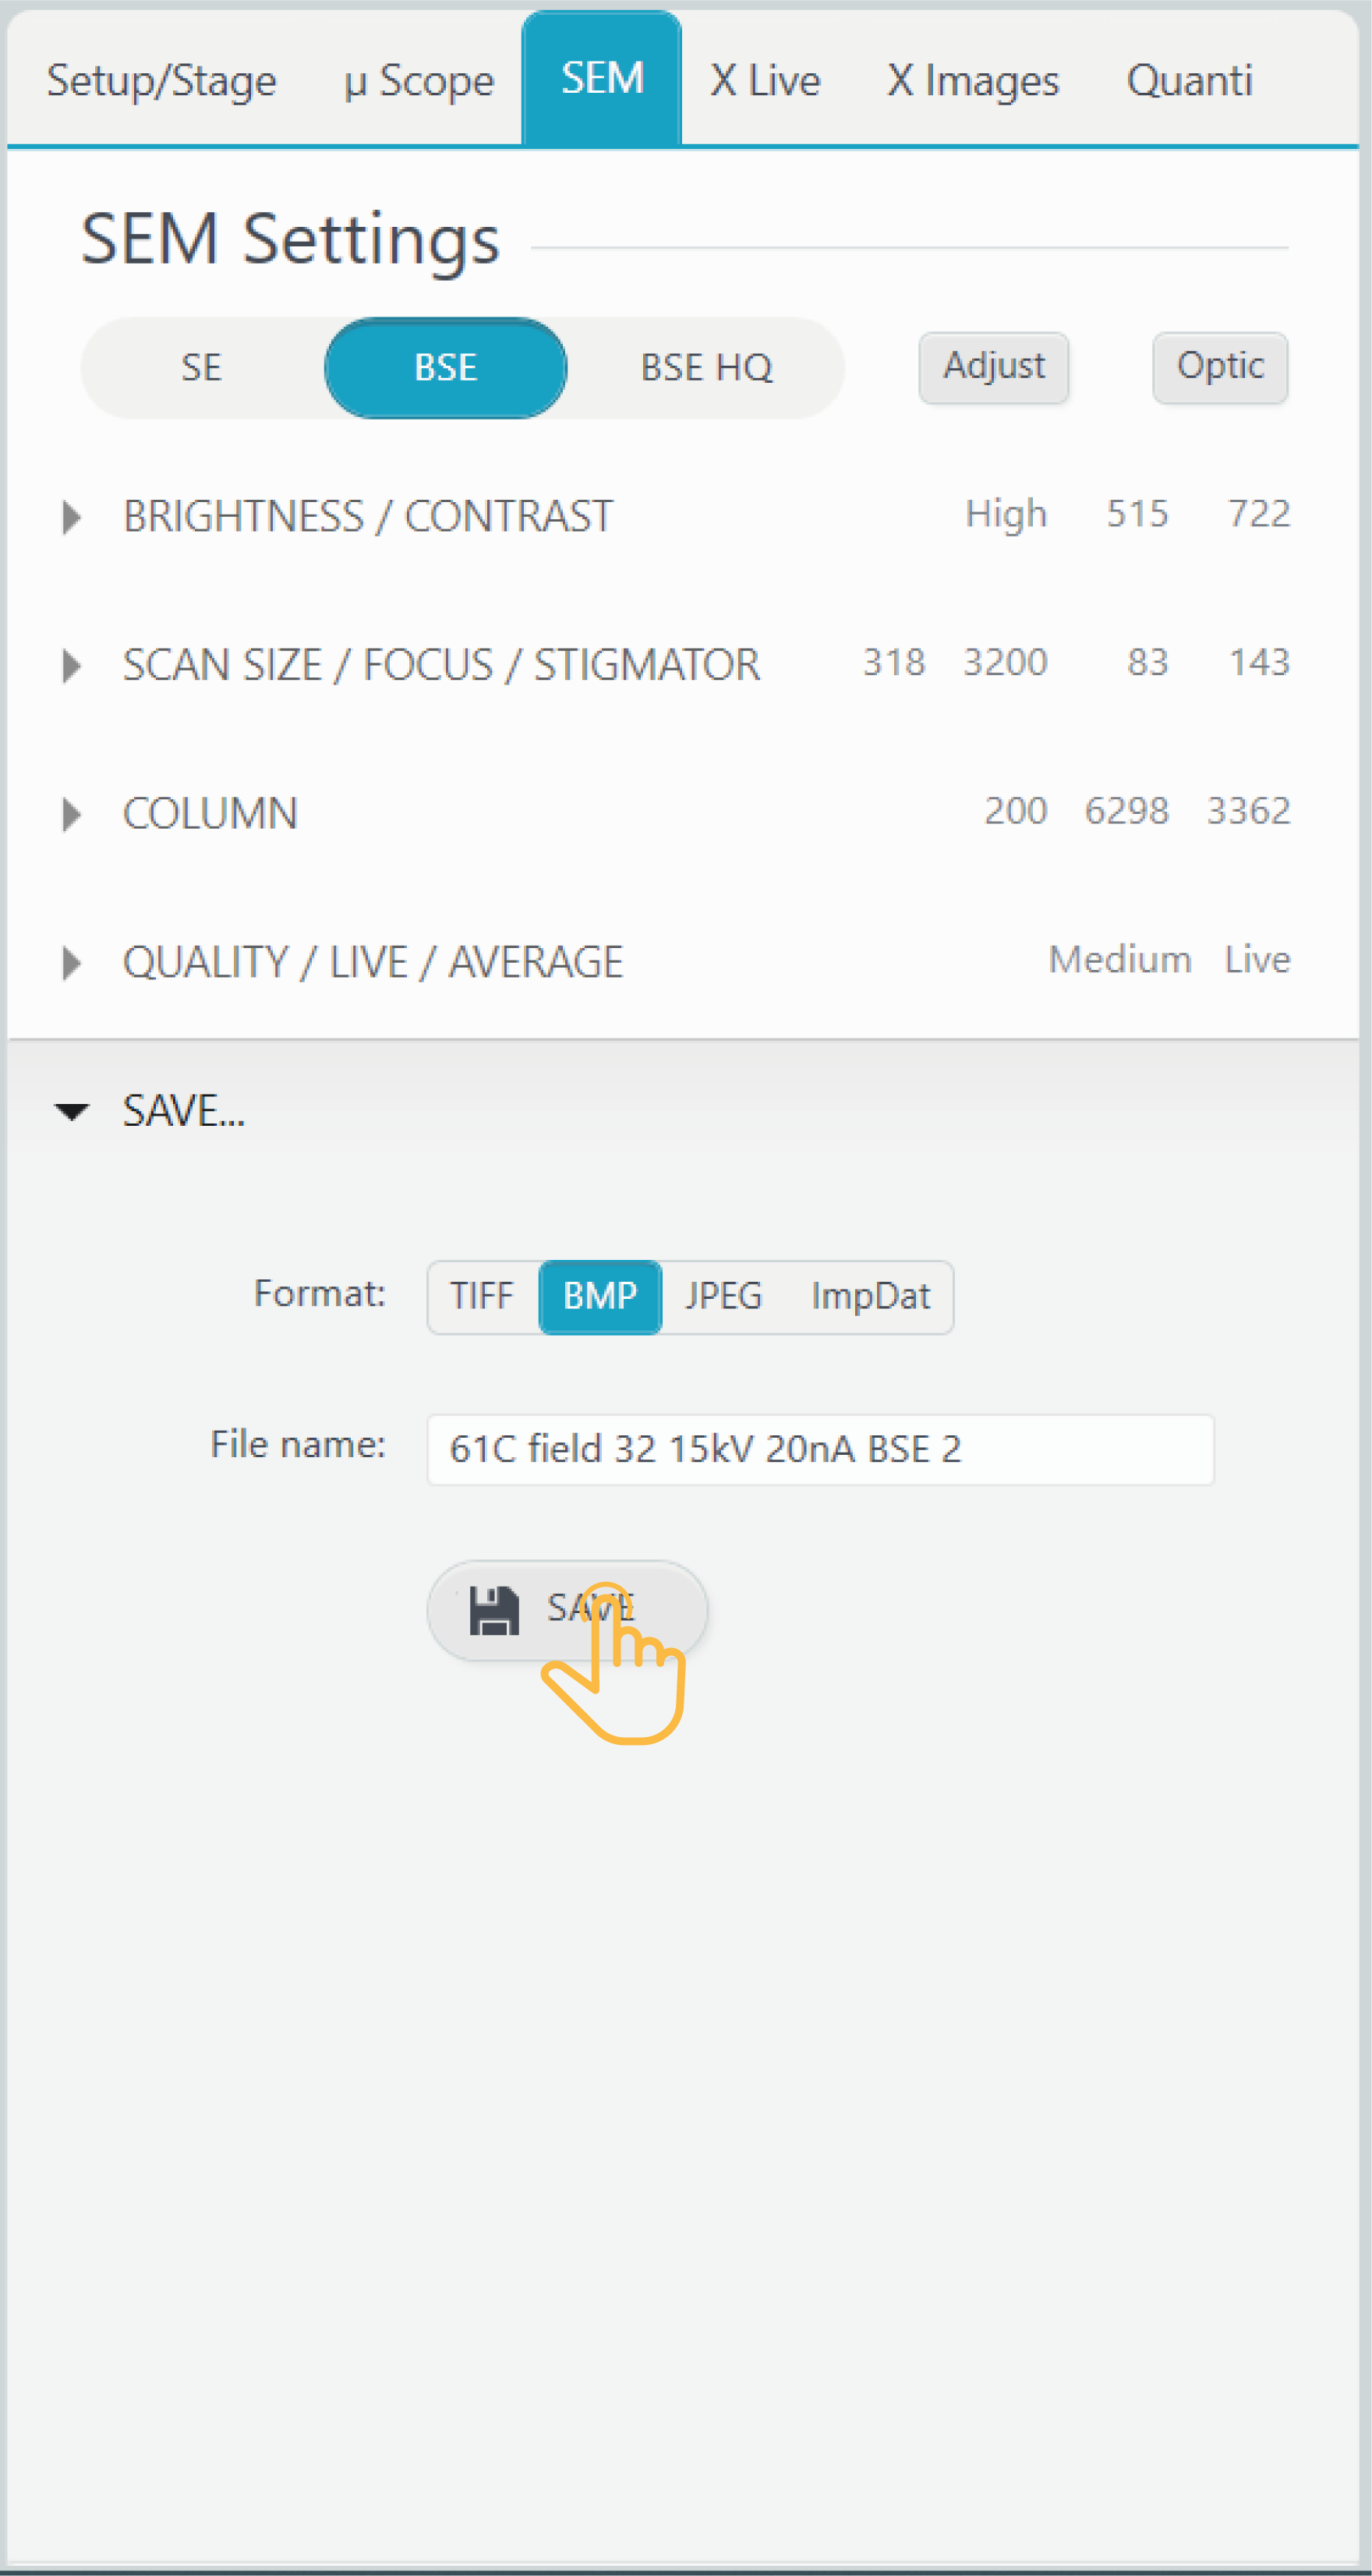
SX-ETU can save the optical microscope image as a TIFF, BMP, JPEG or ImpDat file. ImpDat is a proprietary image format developed by CAMECA, containing additional information, such as XYZ position and instrument configuration.
The file can be viewed only with CAMECA software.After file format selection, designate a filename and press the ‘SAVE’ button.
The file will be automatically saved in the Images&Profiles folder within the previously-defined path (Project/Sample) and automatically opened in the SX-Results program.
.
Related Article
ETU – Introduction
Reading Duration 2min
Why a complex instrument should use a complex interface ? Trying to address this question leads us to rethink all of our softwares to turn them really easy to use. We had to forget all the way we develop softwares since decades and from a white paper, we imagined a new design that can hold advanced functionality together with intuitive touch-screen control in a unique window.
Start With Tactis ETU Software
Reading Duration 6min
Tactis ETU Software is a part of PeakSight 6.3 and late.
ETU – Setup/Stage
Reading Duration 4min
This part describes the SETUP/STAGE tab
Optical Microscopy
Reading Duration 4min
This article presents, in a tutorial mode, how to display and acquire high-quality images from optical microscopy system of the SX-FIVE. Functions are spread into ’Optical microscopy’ (all the hardware controls), ‘Save’ and ‘Mosaic’ subsections.
ETU – XLive
Reading Duration 10min
X Live is a powerful tool designed to draw real time X images using WDS or EDS detection. Images can be acquired separately or as a composite including SEM image as background.
ETU – XImages
Reading Duration 5min
This tab is dedicated to the acquisition of high resolution / high count rate chemical maps.
ETU – Quanti/Check
Reading Duration 18min
The ‘Quanti’ tab provides all the tools necessary to get quantified chemical analysis of any solid sample, but also a range of check procedures to ensure the instrument hardware is well set. Both of them can be reach though the sub-tabs ‘Quanti’ and ‘Check’.
ETU – Configuration – Menu
Reading Duration 10min
Configuration window allows to set ‘Focus Auto Config’, ‘Astigmatism Auto Config’, ‘Expert System Config’, ‘Check standard Config’ and ‘Check Machine Config’.