Contact

Our support team is ready to help you
FAQ

Answers to some common questions from SX users
Troubleshooting

Quickly search for solutions to instrument issues
ETU – XLive
X Live is a powerful tool for rapid visualization of X-ray images collected by WDS or EDS spectrometers. The X-ray images can be shown separately from or overlayed onto a secondary or backscattered electron scanning electron microscope (SEM) image of the sample..
Selection and tuning of X-ray spectrometers
The upper portion of the X Live panel is used to select and tune the X-ray spectrometers.
Elements may be selected manually from a periodic table or selected automatically by scanning the WD or ED spectrometers. The selection process also differs according to the type of X-ray spectrometer.

WDS
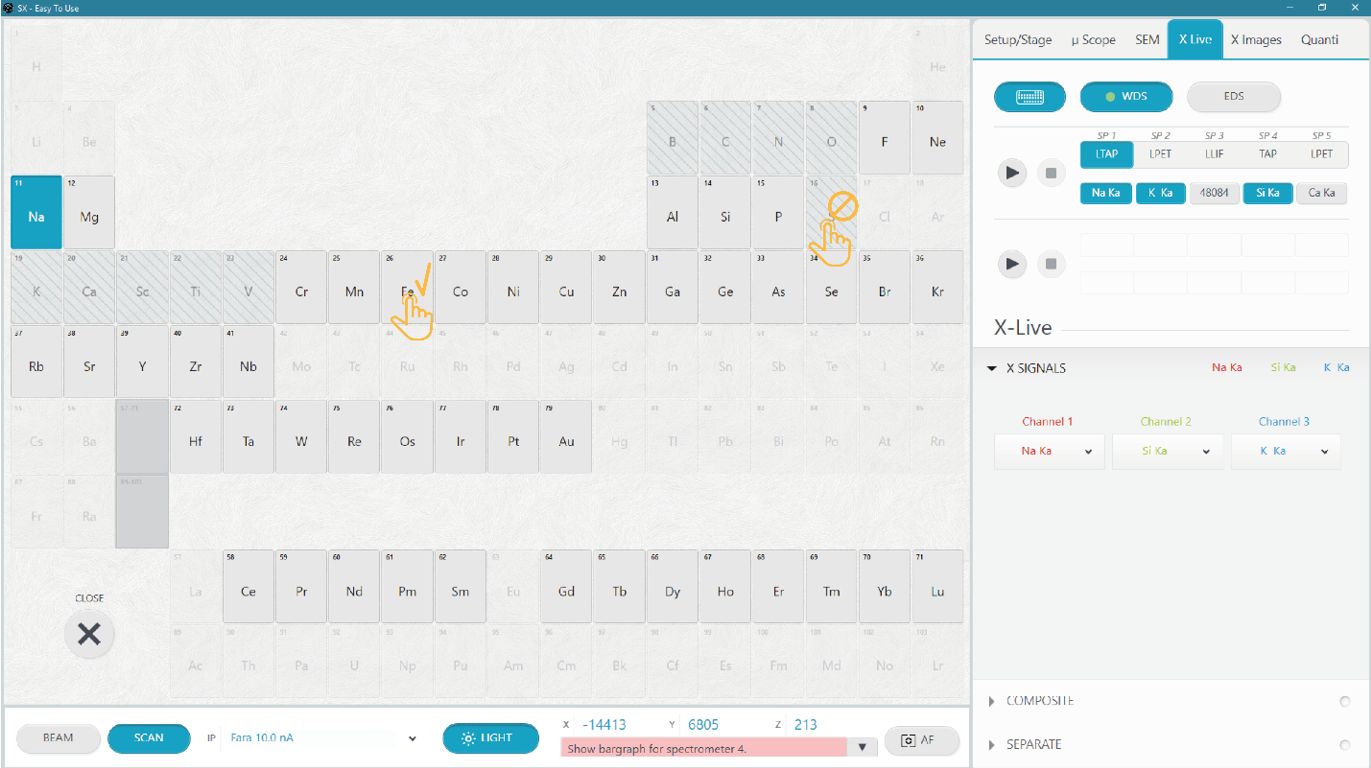
Choose the WDS spectrometer mode by pressing on the ‘WDS’ button 
Manual selection
The WDS button shows a red dot when the beam scanning size is > 100 m to warn the user of potential loss of X-ray intensity at the corners of the image. The loss is caused by WD spectrometer defocusing at large fields-of-view (low magnification). The button shows a green dot when the scanning size is ≤ 100 m (high magnification) and WDS defocusing is minimal.
To select an element for a WD spectrometer, press on the crystal name button for that spectrometer (e.g.,  ), then press the ‘Periodic Table’ button
 to open the selection table. Each crystal has a limited X-ray spectral range and inaccessible elements are shown with a cross-hatched pattern. Double-click one of the accessible elements to move the spectrometer to that element’s X-ray line. There will be a short delay while the spectrometer moves into position.
Automatic selection
Alternatively, elements can be selected by auto-detection. The ‘Run’ button  starts a WDS X-ray spectrum scan at the current location of the beam on the sample. The ‘Stop’ button
  halts an ongoing scan.
The WDS acquisition takes several minutes to scan the full range of each spectrometer. After acquisition, examine the spectra in the SxSAB window. Search for X-ray peaks, either by using the manual Periodic Table tool or with the AutoID tools (RMB-click on the spectra) in the SxSAB program.
Press on the ‘Stop’ button to end the Automatic search.
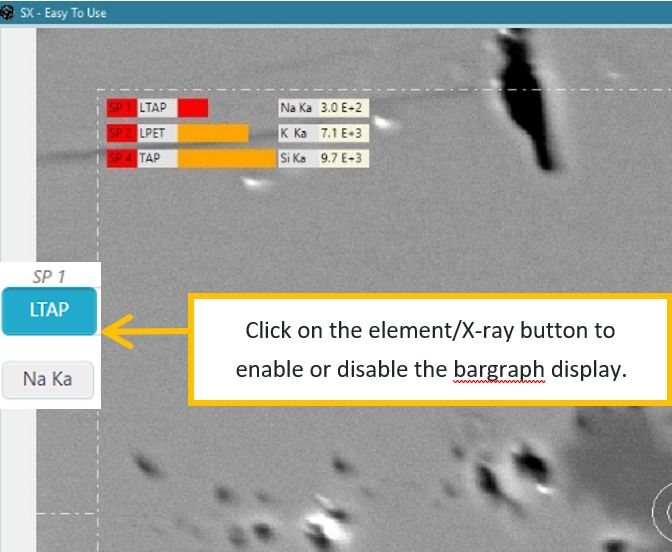
Bargraph display
After element selection, a gauge displaying the X-ray signal intensity for each element (WDS only) appears at the upper left corner of the real-time screen. Individual bargraphs can be enabled or disabled by pressing the corresponding element button.
EDS
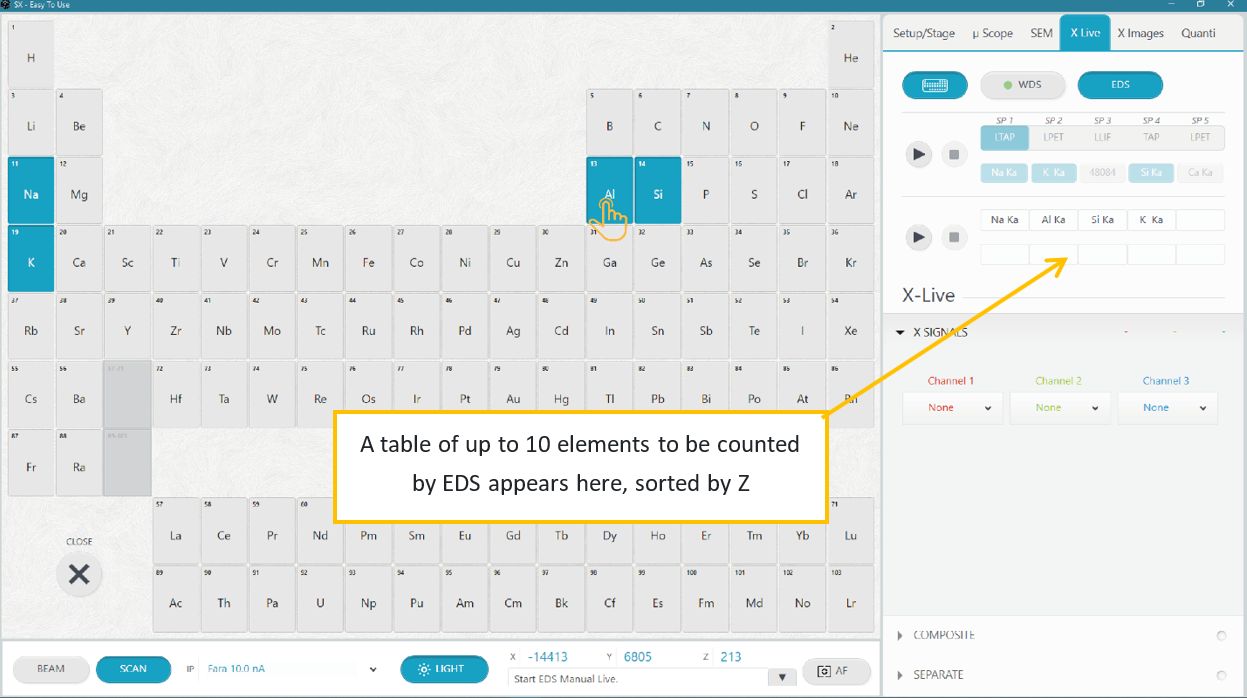
 . Up to 10 elements may be added to the EDS table, from which up to 3 may be chosen for the X Live display.
Manual selection
Press the ‘Periodic Table’ button
. Press on an element to add it to the EDS table. Press on the element a second time to remove it from the table.Automatic selection
The ‘Run’ button
starts an EDS X-ray spectrum acquisition at the current location of the beam on the sample. The ‘Stop’ button halts an ongoing acquisition. For EDS, a spectral scan only takes a few seconds. An automatic element ID routine returns the ten highest intensity elements to the EDS table.
X Live acquisition and display
The lower portion of the X Live tab is dedicated to acquisition of the X Live real-time display.
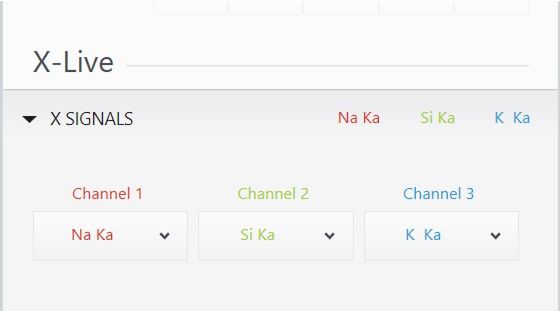
X Signals
The X Live display consists of an electron image and up to three X-ray images, either as separate images or as a composite (overlay) image.
After the WDS or EDS detectors have been tuned to specific X-ray lines, use the drop-down menus to assign an X-ray line to each Channel.
Once X-ray lines have been assigned to Channels, acquisition of X Live images is possible
Composite image display
Press the ‘Run’ button to start the X Live Composite display. The image intensity increases as more counts are acquired in successive sweeps. The live image accumulates counts indefinitely, until it is frozen by pressing the ‘Stop’ button .
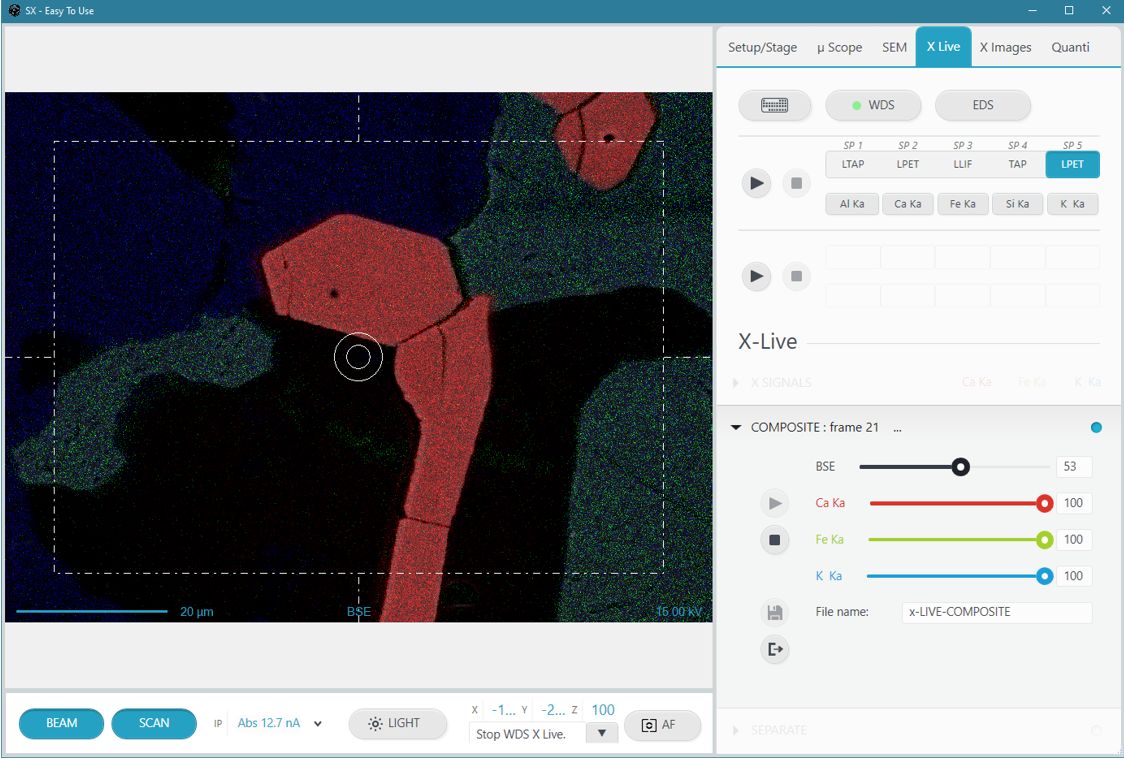
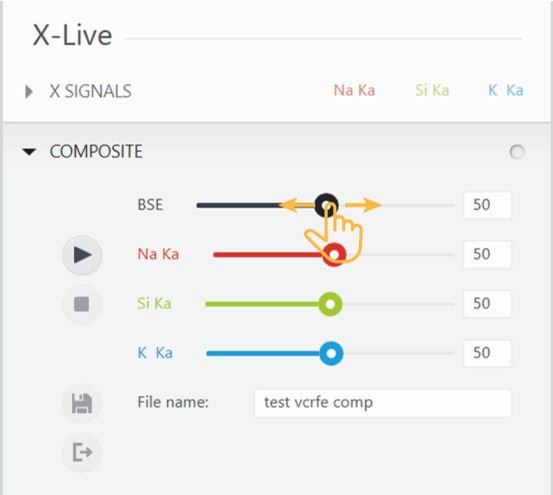
The relative intensity (opacity) of the four images (SEM image plus three X-ray channels) can be adjusted from 0 to 100% with the sliders in the ‘Composite’ panel.
To save the images to disk, press the ‘Save’ button . The image file name is designated in the text field.
To exit the X Live Composite image acquisition, press the ‘Exit’ button . The file is saved in impDat format and opened in the SX Results program.
IMPORTANT: You must exit X Live acquisition to proceed with other SX Five Tactis operations.
Separate images display
Press the ‘Run’ button to start the X Live Separate display. The image intensity increases as more counts are acquired in successive sweeps. The live image accumulates counts indefinitely, until it is frozen by pressing the ‘Stop’ button .
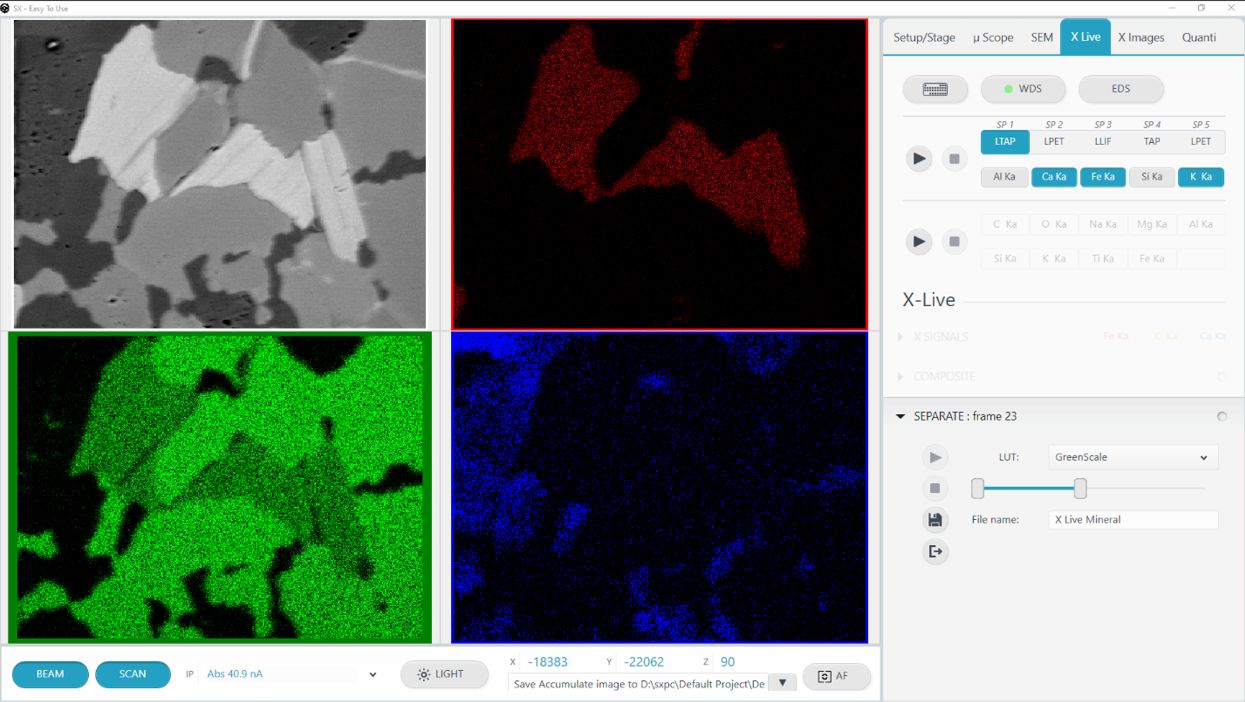
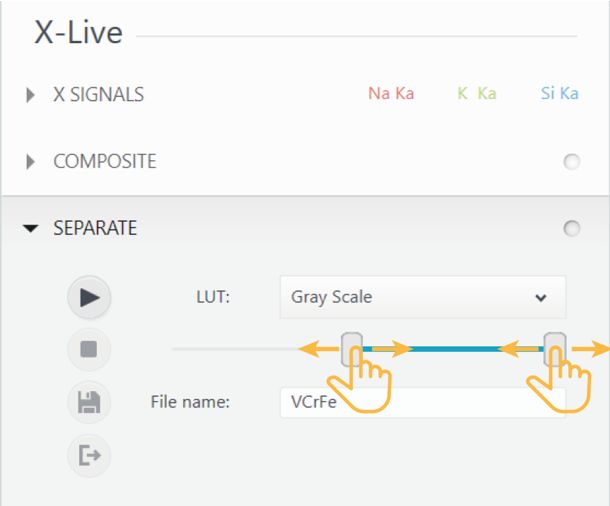
The LUT (Color LookUp Table) and Brightness/Contrast of the SEM image can be modified with controls in the ‘Separate’ panel.
To save the images to disk, press the ‘Save’ button  . The image file name is designated in the text field.
To exit the X Live Separate image acquisition, press the ‘Exit’ button  . The file is saved in impDat format and opened in the SX Results program.
IMPORTANT: You must exit X Live acquisition to proceed with other SX Five Tactis operations.
File saving
The SX Live Separate and Composite images are saved as ‘impDat’ files.
‘impDat’ files are proprietary image formats developed by CAMECA. They contain additional information, such as XYZ position and instrument configuration. These files can be viewed only with CAMECA software.
The files are saved in the Images&Profiles folder within the currently defined path (Project/Sample) and can be opened in the SX-Results program for additional image processing, including exporting to other file formats, such as TIFF, JPEG, and BMP.
Related Article
ETU – Introduction
Reading Duration 2min
Why a complex instrument should use a complex interface ? Trying to address this question leads us to rethink all of our softwares to turn them really easy to use. We had to forget all the way we develop softwares since decades and from a white paper, we imagined a new design that can hold advanced functionality together with intuitive touch-screen control in a unique window.
Start With Tactis ETU Software
Reading Duration 6min
Tactis ETU Software is a part of PeakSight 6.3 and late.
ETU – Setup/Stage
Reading Duration 4min
This part describes the SETUP/STAGE tab
Optical Microscopy
Reading Duration 4min
This article presents, in a tutorial mode, how to display and acquire high-quality images from optical microscopy system of the SX-FIVE. Functions are spread into ’Optical microscopy’ (all the hardware controls), ‘Save’ and ‘Mosaic’ subsections.
Scanning Electron Microscopy
Reading Duration 11min
Electronic images are provide though the Scanning Electron Microscopy functionalities of the SX-FIVE. Three detectors are available.
ETU – XImages
Reading Duration 5min
This tab is dedicated to the acquisition of high resolution / high count rate chemical maps.
ETU – Quanti/Check
Reading Duration 18min
The ‘Quanti’ tab provides all the tools necessary to get quantified chemical analysis of any solid sample, but also a range of check procedures to ensure the instrument hardware is well set. Both of them can be reach though the sub-tabs ‘Quanti’ and ‘Check’.
ETU – Configuration – Menu
Reading Duration 10min
Configuration window allows to set ‘Focus Auto Config’, ‘Astigmatism Auto Config’, ‘Expert System Config’, ‘Check standard Config’ and ‘Check Machine Config’.