Configuration – General
Overview
The General panel, accessible through one click on the ‘General’ tab, defines the machine type and control parameters, as well as the hardware, software and miscellaneous options.
Machine Type
The Machine Type indicates the model and generation of the instrument being used for the experiment.
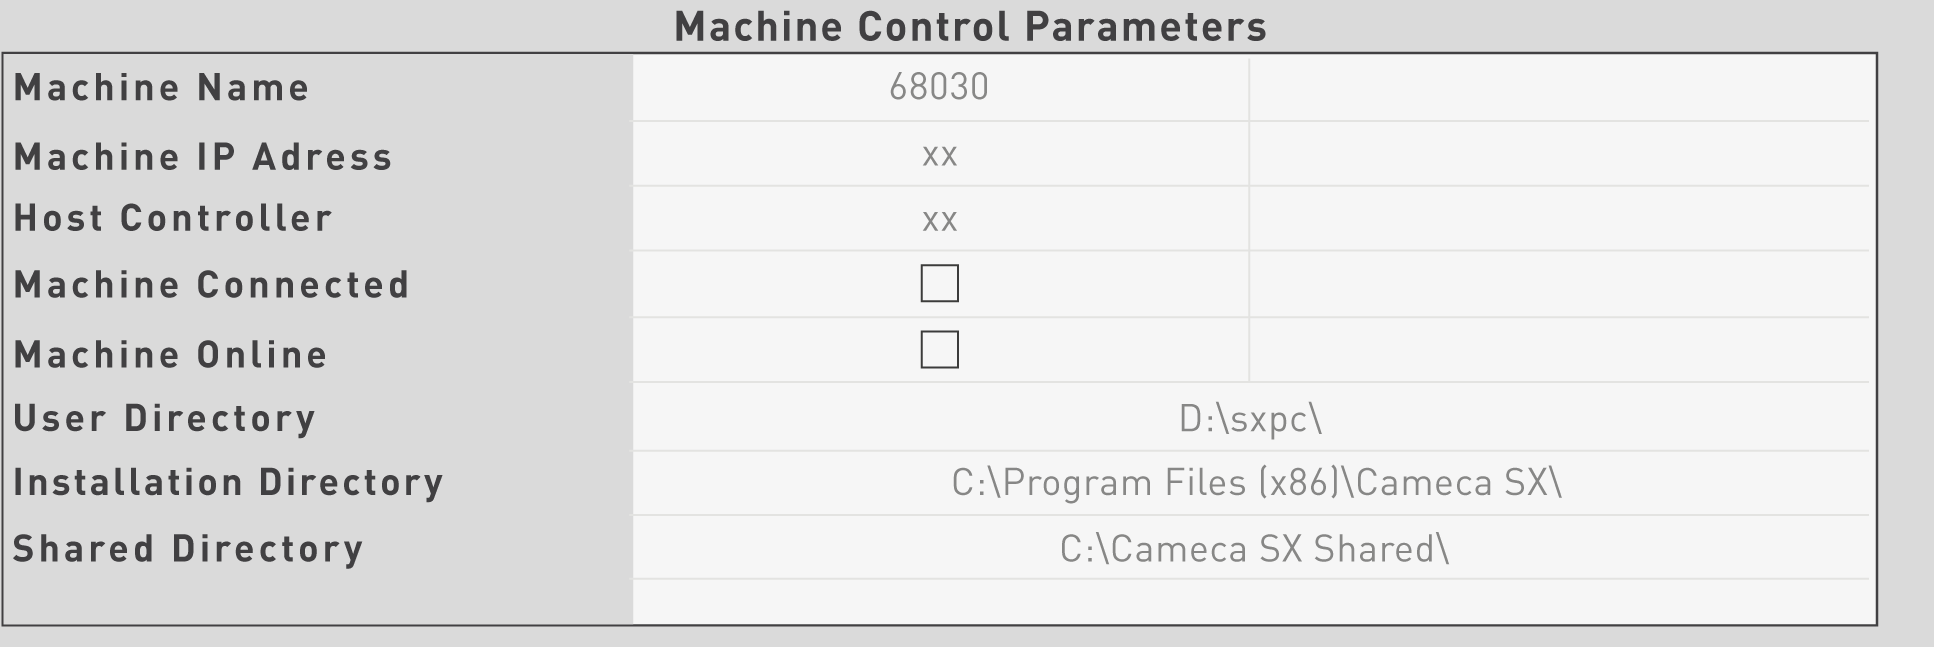
Machine Control Parameters
The Machine Control Parameters sub-window shows hardware-specific information about the instrument such as its serial number, its IP Address and Host Controller. Beside indicating if the instrument is connected or online, software information regarding the location of the directories for data storage, SX program and shared data is also noted.
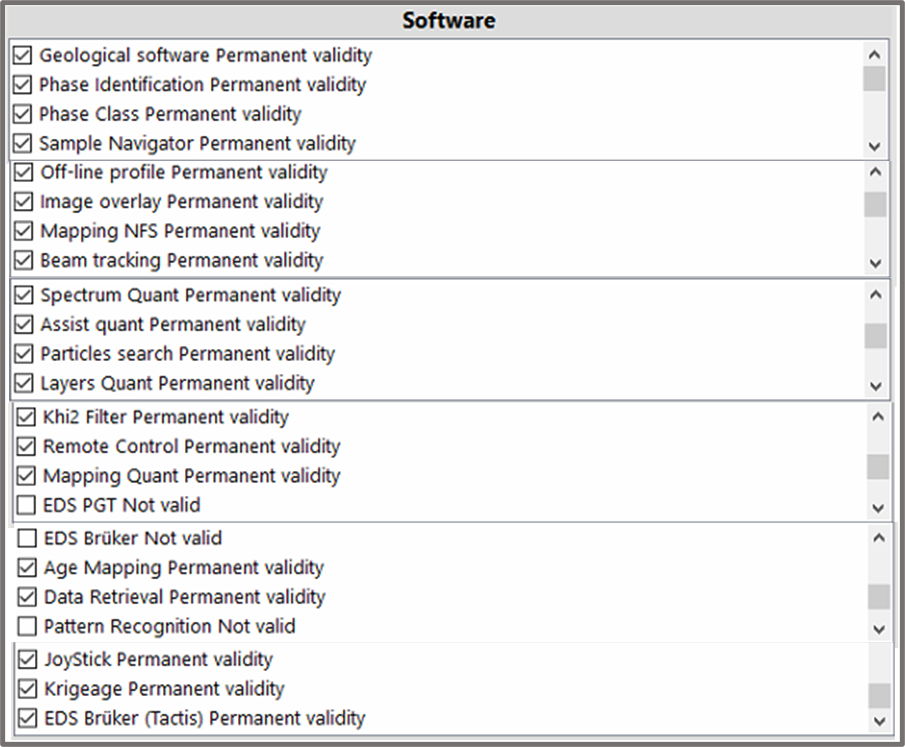
Software
The software sub-window indicates all the different software options available as well as their activation status (Permanent validity vs. Not valid).
Geological Software Suite
The Geological Software option contains the geological quantitative analysis program (Geo Quant) dedicated to on-line and off-line mineral analysis with specific choice of analytical standards and structural formula for each analysis point.
Phase Identification
The phase identification option allows phase-mapping using binary and ternary X-ray intensity plots. Phases are first selected by the user on a binary or ternary diagram and then reconstructed in dedicated images where modal analysis is available.
Phase Class
The Phase Class option applies to the classification of complex matrices (unlimited number of elements or phases) and provides fast modal analysis.
Sample Navigator
The Sample Navigator option enables the optical conversion of off-line optical images to display on the PC workstation. It assists the user in locating areas of interest by using a low magnification image of the specimen loaded on the stage.
Off-line Profile
The Off-line profile option is used to reconstruct multiple qualitative profiles along lines or bands superimposed on previously acquired digital images.
Image Overlay
The Image overlay option allows the user to easily produce so-called “combination maps”, i.e. images displaying simultaneously all the “combination phases” which can be obtained by combination of three different elements A, B and C.
Mapping NFS
The Mapping NFS option allows WDS mapping with vertical spectrometers, without the X-Ray defocusing effects due to non-flat sample surfaces. The sample surface is mathematically modeled on the basis of a pattern of 9, 16 or 25 reference X, Y, Z points. The Z coordinates are extracted from automated sequences of optical auto-focus performed on the sample surface. A 3D representation of the maps is available with this option, enabling a realistic display of the surface at the micrometer scale.
Beam Tracking
The Beam tracking option allows beam repositioning with a reproducibility of 0.1µm. A BSE or SE image is captured and stored once the analysis points are defined. During the acquisition, the image is re-acquired, then compared to the stored image and the electron beam is shifted until the new image perfectly fits the stored image.
Spectrum Quant
The Spectrum Quant option is based on a spectrum acquisition. This feature provides a way to obtain the sample composition in a short time with the advantages of the WDS system, and by keeping a reasonable accuracy. From a qualitative spectrum, Spectrum Quant indexes peaks automatically, then the area under the peaks is used for quantification along with the calculation of the standard intensity of the selected lines.
Assist Quant
The Assist Quant option(link) (includes Spectrum Quant) helps in optimizing the choice of every analysis parameter and automating the stages of a quantitative analysis, for all kind of materials. It performs and uses the qualitative sample composition to suggest relevant instrument configurations for accurate quantification.
Particles Search
From an x-ray map, the Particles Search option detects the position of each particle present in the image. All the detected positions are automatically transferred into a quantitative analysis matrix, and all the particles present in the image can then be quantified. Particles Search can be used on-line, during the image acquisition, when one cell of the image is acquired, or off-line, with an image already acquired.
Layer Quant
The Layers Quant program calculates parameters such as the thickness and the composition of multilayered samples. These parameters are derived from quantitative measurements on a layered sample at various voltages, and from a description of each layer, to calculate the thickness and the composition of each layer.
Chi² Filter
The Chi² Filter test program is part of the various counting configurations that can be explored in SX-SAB in order to extract information in a more useful way based on materials, trace elements, sensitivity to electron beam, and background shape among few parameters.
The Chi² test is derived from the chi-square distribution to compare nominal data derived from unmatched groups of subjects.
Mapping Quant
The Mapping Quant option leads to a true quantification of x-ray maps. Based on the images acquired on peak and background lines, the Mapping Quant procedure which requires using a calibration for each measured element, processes the data in a true quantification procedure with a correction matrix applied pixel by pixel to the whole image. Results are displayed in quantitative weight % (wt.%) and atomic % (at. %) images, and the concentration at each pixel or for a set of pixels is available and can be exported in quantitative data files.
Brücker
Brücker and CAMECA facilities are integrated in a common PC workstation, offering:
- Combined EDS and WDS quantitative data treatment.
- Combined qualitative analysis.
- Combined image acquisition (up to 8 EDS, 5 WDS, 2 video signals).
Age Mapping
The Age Mapping option (Includes Mapping Quant) is dedicated to calculating the ages of monazite particles. This option includes two specific software programs:
1- Age Map: calculates the age pixel by pixel from quantitative mapping of the elements U, Th, and Pb. The result is presented as an image, and the grey level of the pixel represents the age in Ma of the corresponding point
2- Age Quant: calculates the age and the error on the age estimation from the quantitative measurements of the elements U, Th and Pb.
Data retrieval
The ‘Data retrieval’ program is dedicated to making a quick search and a quick display of the data files sharing the same directory on a hard disk, network drive or removable media. It also lists the files corresponding to a user defined criteria. Ex: all images containing Si, all WDS spectra acquired at 20 keV, etc.
Joystick Utility
The Joystick utility is used to control the motion of the specimen stage, the Z-Focus and also to stored analysis point.
Hardware
The hardware sub-window indicates the different physical parts available on the instrument as well as their activation status confirmed by the Valid/Not valid attribution.
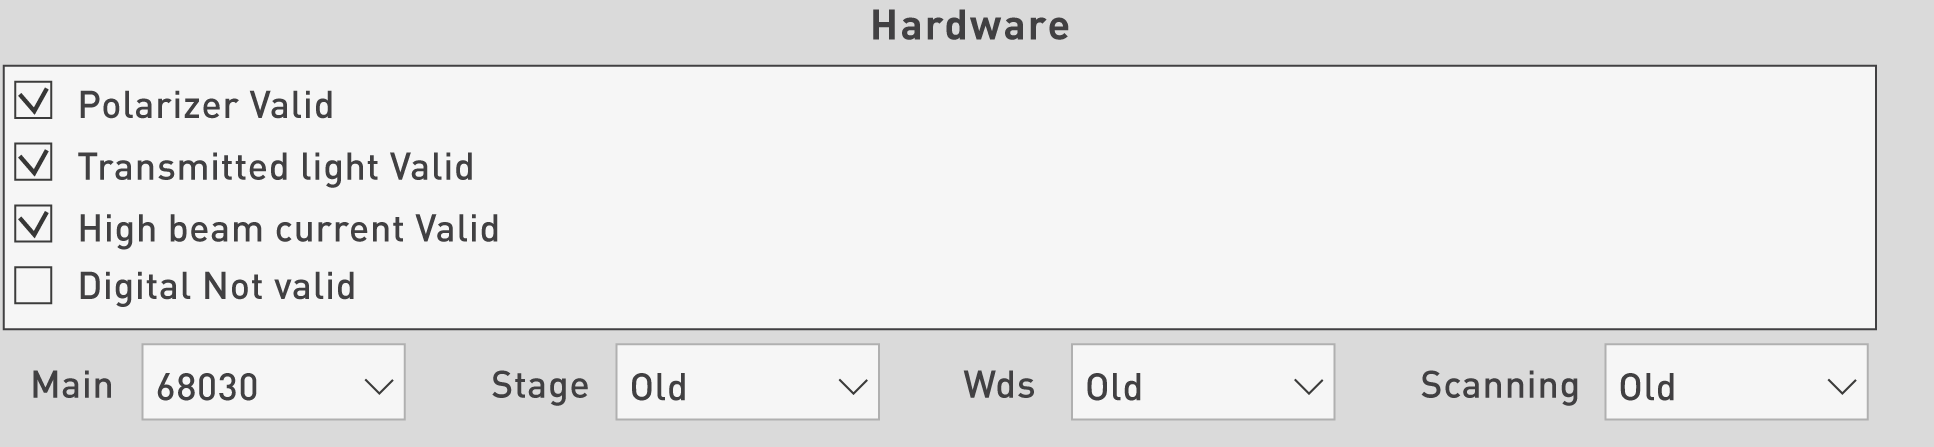
All the parts mentioned in the Hardware list on figure above are described or discussed within the SX-Control help. Therefore, we will not duplicate them in the current section.
An additional menu, still under the Hardware section, allows users to select the type of ‘Main’ computer board, ‘Stage’ and ‘WDS’ systems as well as the ‘Scanning’ configuration.
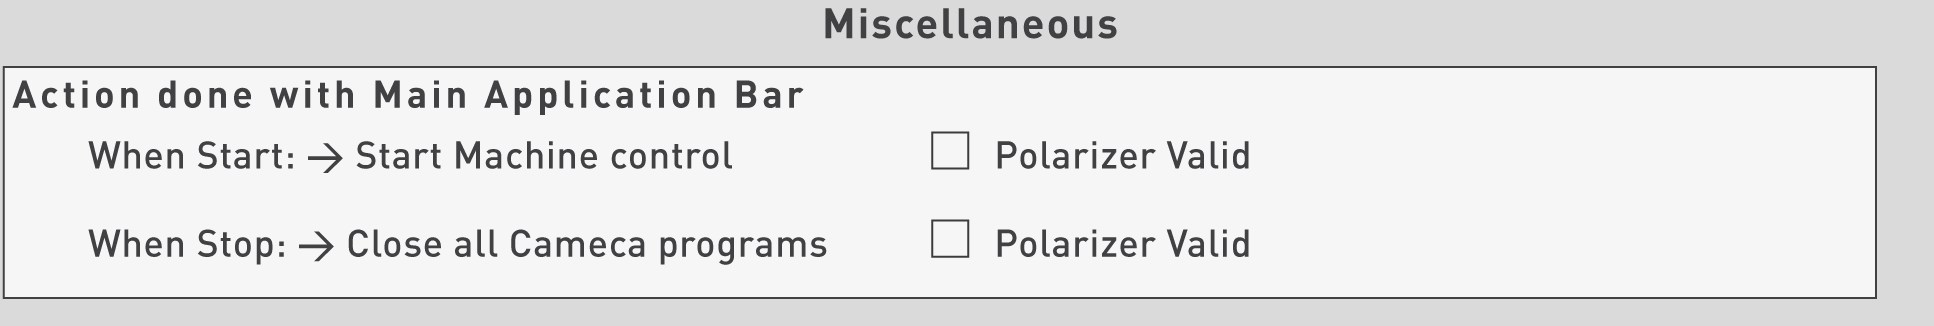
Miscellaneous
Action items can be programmed via the ‘Miscellaneous’ sub-window when the Main SX-AppBar of PeakSight software is launched or interrupted. For instance, the Start Machine control may be enabled upon opening the software (SX-Control), or users can decide to automatically terminate all Cameca programs upon exiting the software, which could be useful in the case of an unresponsive communication link between hardware and software.
Related Article
Configuration – Overview
Reading Duration 3min
The Configuration is the third application from the Utilities tab in PeakSight and probably the most extensive one as it contains 11 sections.
Configuration – Stage
Reading Duration 3min
The Stage tab, accessible by clicking on the corresponding icon, allows users to access and control some of the parameters linked to the stage motion and automated functions such as Stage Position, Storage Position, Autofocus and Miscellaneous.
Configuration – Spectrometer
Reading Duration 2min
The ‘Spectrometers’ tab, accessible by clicking on the corresponding icon, provides mostly information rather than controls because most of the parameters are already set. This is why so many of these parameters are greyed-out. However, users and FSEs have access to this information on spectrometers.
Contact

Our support team is ready to help you
FAQ

Answers to some common questions from SX users
Troubleshooting

Quickly search for solutions to instrument issues